
1. Introduction
Indonesia is known as a maritime country with a sea area of 3,257,357 km². Indonesia's vast marine territory offers abundant and promising fishery resources. Capture fisheries commodities have the potential to improve the economy in Indonesia in terms of coastal community livelihoods [1]. Fishing activities are carried out in an Open Access manner so that they can be freely accessed by anyone. This policy provides a greater diversity of fish for consumption and trade. However, on the other hand, the absence of restrictions on the number of fish caught can lead to overfishing [2]. One of the potential waters in Indonesia is the waters of Pangandaran Regency with a coastline of 91 km. Based on data from the Department of Marine Affairs, Fisheries, and Food Security (DKPKP) Pangandaran, in 2023 the weight of capture fisheries
production in Pangandaran Regency reached 2,538 tons with a total production value of IDR 54,090,510,251 [3].
One of the potential commodities is largehead hairtail (Trichiurus lepturus) with a production weight of 197 tons in 2022[3]. Largehead hairtail is known to have a high amino acid content as a source of protein and omega-3 for humans which is nutritious and supports human growth and health [4]. This makes largehead hairtail widely chosen as a raw material for the food industry with various processing such as salted fish, pindang fish, to mixtures in soup [5,6]. Along with human consumption needs, the demand for largehead hairtail continues to increase. While this could potentially increase the income of fishermen as key production actors, it also carries the risk of exploitation that could exceed the carrying capacity, ultimately contributing to overfishing.
The concept of sustainable fisheries resource management can be formulated through a bioeconomic approach to achieve a balance between human needs and the sustainability of natural resources. The bioeconomic approach will consider two aspects from the economic and ecological sides. In this context, there are two main concepts that need to be understood, namely Maximum Sustainable Yield (MSY) and Maximum Economic Yield (MEY). MSY refers to the maximum amount of catch that can be obtained sustainably from a fish population without reducing the population's ability to reproduce. Meanwhile, MEY focuses on the maximum economic benefit that can be obtained from fishing by considering the cost of income, profit, and long-term ecological impacts [5,6].
Based on the previous explanation, it is necessary to conduct a study on the management of largehead hairtail resources to prevent overfishing through biotechnical, bioeconomic studies and optimization of largehead hairtail resource management in the Coastal Waters of Pangandaran Regency. Therefore, this study must be recognized as balancing economic benefits and the sustainability of largehead hairtail commodities in the common interest.
2. Methodology
In this study, a case study method was employed to examine the management of largehead hairtail (Trichiurus lepturus) resources in Pangandaran Regency, West Java Province. This study collected two types of data, namely primary and secondary data. Primary data was obtained through direct observation and interviews with 30 respondents of fishermen. Secondary data was obtained from the Cikidang Fishing Port, Department of Marine Affairs, Fisheries, and Food Security (DKPKP) Pangandaran, and the Central Statistics Agency (BPS) of Pangandaran. Secondary data obtained include the weight of the catch, number of trips, types of fishing gear, production value, average price, and details of fishermen's expenses in one trip. The data was collected over six years from 2018 to 2023. Once the data is collected, an analysis can be conducted based on the problems to be studied.
2.1 Analysis of Characteristics of Largehead hairtail
Fish samples were observed morphologically and recorded. Secondary data in the form of monthly catch data for six years were processed and data visualization was carried out with graphs to understand the monthly catch. It was conducted to understand the life cycle of the largehead hairtail, focusing on reproduction, spawning periods, and adult growth.
2.2 Biotechnical Analysis
Biotechnical analysis aims to determine the ability of fishermen's fishing gear and determine standard fishing gear. There are five types of largehead hairtail fishing gear in Pangandaran, a comparison of CPUE (catch per unit effort) [7] and FPI (Fishing power index)[8] is carried out using the following formula:
\[CPUE_i = \frac{c_i}{E_i} \tag{1}\]
\[FPI_{S} = \frac{CPUE_{S}}{CPUE_{S}} \tag{2}\]
\[FPI_i = \frac{CPUE_i}{CPUE_S} \tag{3}\]
2.3. Bioeconomic Analysis
Bioeconomic analysis involves several biological and economic parameters. In this analysis, the secondary data utilized includes fishing effort (Et) and CPUE (Ut), which are analyzed using linear regression.
Estimation of biological parameters aims to determine the intrinsic growth rate (r), fishing gear coefficient (q), and environmental carrying capacity (K). This study compares three models, namely Walter-Hilborn, Schnute, and CYP (Clarke Yoshimoto Pooley). The variables and formulas of each model are presented in Table 1 [9].
In addition, an estimate of sustainable products is conducted to determine the effort (EMSY) and catch (CMSY) based on the Maximum Sustainable Yield (MSY) approach (Table 2). Utilization rate calculations are conducted to assess resource effectiveness and promote sustainability. Excessive utilization rates (UR) may lead to overfishing, which occurs when fishing exceeds the environmental carrying capacity [10]. The UR formula is as follows.
\[URt = x 100\% \frac{c_t}{c_{MSY}}\] (4)
In its utilization, it is necessary to consider the Total Allowable Catch (TAC) or the amount of catch permitted which is 80% of CMSY or can be written using the formula [9].
\[TAC = 80\% \times CMSY \tag{5}\]
The estimation of economic parameters aims to determine the actual input cost (c) per trip and the actual output price (p) per ton of catfish in Pangandaran. These costs and prices are adjusted using the Consumer Price Index (CPI) to provide a clearer picture of real profits, as this takes inflation into account [11].
(1) Real input cost formula
\[C_{pi} = \Sigma trip \times \frac{\Sigma biaya}{trip} \tag{6}\]
\[\bar{C}_{pi} = \left(\frac{h_{pi}}{h_z}\right)^{\frac{1}{t}} \tag{7}\]
\[C_{sdt} = \frac{c_{pi} \times \bar{c}_{pi}}{100000} \tag{8}\]
\[C_t = (C_{std} \times IHK)/IHK_n \tag{9}\]
(2) Real output price formula
\[P_n = \frac{\sum_{n}^{n} p_t}{n} \tag{10}\]
\[P_t = \frac{P_n}{IHK_n} \times IHK_t \tag{11}\]
2.4. Economic Rent Estimation
The bioeconomic analysis employs the Gordon-Schaefer model, utilizing the linear regression method represented by the following equation:
\[CPUE = \alpha - \beta E \tag{12}\]
α = intercept (constant, Y value if x=0) β= slope (slope of the regression line)
Additionally, the values of α and β are used to calculate the equilibrium in the Gordon-Schaefer model, as shown in Table 3 [12]. This model compares three approaches: Maximum Sustainable Yield (MSY), Maximum Economic Yield (MEY), and Open Access Effort (OAE). In the calculations, two previously established economic parameters are utilized: real costs (c) and real prices (p). Furthermore, the total income of fishermen from their catch (TR), total fishing costs (TC), and economic rent (π) can be determined [12].
3. Results and Discussion
3.1. Characteristics of Largehead hairtail (Trichiurus lepturus)
Largehead hairtail are classified as demersal/semi-pelagic fish that can be found in waters with a depth of 0—100 meters below sea level with a muddy bottom [13]. This fish can be found in shallow waters and even on the sea surface at night. This is related to the feeding behavior of largehead hairtail. Generally, juvenile largehead hairtail eat small planktonic crustaceans such as euphausiids, as well as small fish such as anchovies. When adults, largehead hairtail tend to become piscivorous and eat various other types of fish, including anchovies, sardines, small fish, squid and crustaceans. The feeding behavior of largehead hairtail is related to vertical diurnal migration. At night, juvenile and adult largehead hairtail gather near the sea surface to prey on plankton and small fish. However, during the day, adult largehead hairtail
Table1.BiologicalParameterVariablesandFormulas
| Walter Hilborn Model | ||||||
|---|---|---|---|---|---|---|
| 𝑈𝑡+1 𝑌 = 𝑈𝑡 | X1= 𝑈𝑡 | X2 = Et | ||||
| r = 𝛼 | q = −𝛾 | K = −𝑟 𝛽𝑞 | ||||
| Schnute Model | ||||||
| 𝑈𝑡+1 𝑌 = 𝑈𝑡 | X1= 𝑈𝑡 | X2 = Et | ||||
| r = 𝛼 | q = −𝛾 | K = −𝑟 𝛽𝑞 | ||||
| CYP Model | ||||||
| Y = ln(Ut+1) | X1 = ln(Ut) | X2 = Et + Et+1 | ||||
| r = 𝛼 | q = 𝛾 | K = 𝑟 𝛽𝑞 | ||||
Table2.SustainableProductVariablesandFormulas
| Schaefer Model | ||||||
|---|---|---|---|---|---|---|
| Y = Ut | X = Et | |||||
| −𝛼 2 − 𝛼 EMSY = CMSY = 2𝛽 4𝛽 | ||||||
| Fox Model | ||||||
| Y = ln(Ut) X = Et | ||||||
| 1 CMSY =− × 𝑒𝑥𝑝 (𝛼 − 1) 𝛽 | 1 EMSY = − 𝛽 | |||||
| Output | MSY | MEY | OAE |
|---|---|---|---|
| Catch (C) | 2 α /4β | 2 αEMEY- β(EMEY) | 2 αEOAE- β(EOAE) |
| Arrest attempt (E) | α /2β | (pα -c)/(2pβ) | (pα - c)/(pβ) |
| Total revenue (TR) | CMSY.p | CMEY.p | COAE.p |
| Total expenditure (TC) | c.EMSY | c.EMEY | c.EOAE |
| Economic rent (π) | TRMSY-TCMSY | TRMEY-TCMEY | TROAE -TCOAE |
Table 3.Gordon-SchaeferCalculation Formula
(Source: Processed from statistical data on capture fisheriesfrom theCikidang Fishing Portfor 2018-2023)
can be found looking for food on the sea surface while juvenile largehead hairtail tend to return to the seabed to look for food [14].
Figure 1 shows the highest catch of largehead hairtail in October and the lowest in April. In one year, there was a significant increase in catch from July to August. The difference in catch was influenced by the largehead hairtail spawning season. Fishermen's fishing operations were influenced by weather and monsoon factors, namely the west wind season in December—March, the east wind season in August—September, and the transition season, namely in April—July and October—November. The largehead hairtail spawns from April to July, with its fishing season primarily occurring in October, November, and December. Widyanto (2008) explained that fishing in the transition season should not be done because the fish are in the spawning period [15].
3.2. Biotechnical Analysis
Different fishing fleets utilize various fishing gears for operations, each with distinct catch capacities. Therefore, it is necessary to standardize fishing gear to determine fishing gear with high productivity.
Figure 2 show that 86% of largehead hairtail fishermen in Pangandaran use Drift net, followed by Beach Seine and Purse Seine in second place at 4%, and the rest, namely Hand Line and Liong Bun, are only used by 3% of largehead hairtail fishermen. The drift net is effective for catching largehead hairtail because it efficiently captures these fish as they gather to feed at night. The size and mesh of the net are specifically designed to catch only large adult fish, while allowing smaller, immature juvenile fish to pass through unharmed. In Table 4, it is known that the fishing gear with the highest average CPUE of 32.86 is the purse seine. Therefore, the standard fishing gear for largehead hairtail is the purse seine with an FPI value of 1. The results of this FPI calculation show that the purse seine fishing gear has the highest productivity compared to drift net, beach seine, hand line, and liong bun.
Actual field data shows that largehead hairtail fishermen use drift nets more than purse seines. Based on direct interviews, drift nets are the choice of the majority of small fishermen in Pangandaran with boat sizes <5 GT. Despite the relatively low price of drift gillnets, their catch is minimal.
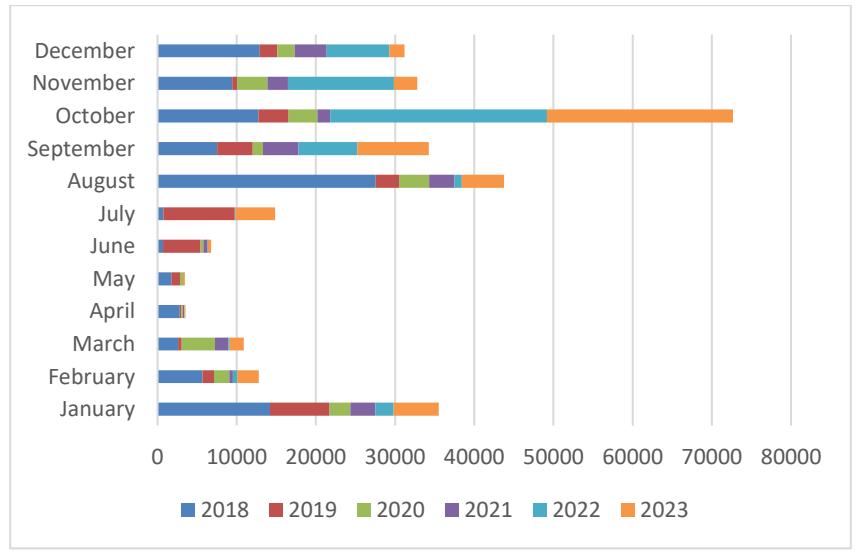
Figure 1. HistogramofCatchesPer Month
(Source: Processed from statistical data on capture fisheriesfrom theCikidang Fishing Portfor 2018-2023)
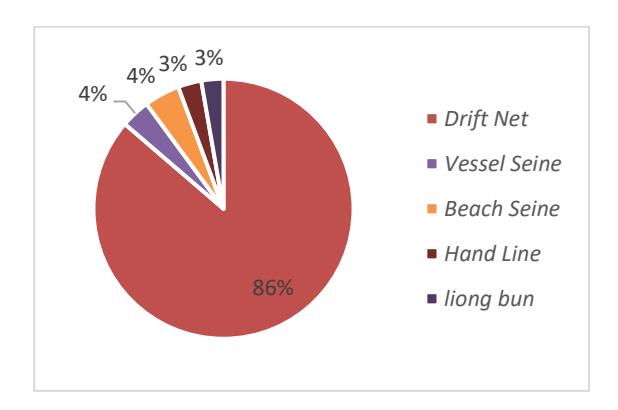
Figure2.Percentagegraphoffishing gearuseinPangandaran. (Source: Processed from statistical data on capture fisheriesfrom theCikidang Fishing Portfor 2018-2023)
Meanwhile, purse seines allow for a greater and more varied number of fish catches because of the smaller mesh size and longer nets [16].
3.3. Bioeconomic Analysis
Bioeconomic analysis encompasses various biological and economic parameters. This analysis is divided into four distinct parts such as biological parameter estimation, sustainable product estimation, economic parameter estimation, and optimization of economic rent.
3.3.1 Biological Parameter Estimation
The determination of biological parameter estimation compares three models, namely the Walter-Hilborn model, the Schnute model, and the CYP (Clarke Yoshimoto Pooley) model. Based on Table 5, the CYP model is more appropriate than other models because it produces positive biological parameters with an R square of 0.299. The CYP model produces an r value (intrinsic growth rate) of 0.872 tons. This indicates that the hairtail resources will increase naturally by 0.872 tons equivalent to 872 kg per year without human intervention or natural phenomena. The q value (fishing gear coefficient) is 0.00012. This indicates that each increase in the hairtail fishing effort unit will have an effect of 0.00012 tons equivalent to 0.12 kg per trip. The K value (environmental carrying capacity) is 277,083 tons. This indicates that the maximum hairtail population size in Pangandaran is 277,083 tons.
3.3.2 Sustainable Product Estimates
Determination of the amount of catch and sustainable fishing effort compares the Schaefer and Fox models. Determination of the best model can be done by looking at the R square. The R square of the Fox model is 0.138 which is greater than the R square of the Schaefer model which is 0.117. Table 6 presents the level of utilization each year in the range of 2018—2023 based on the Fox model. Overall, the average utilization rate of the largehead hairtail is 42.69% with a 'developing' status. This condition provides an opportunity for fishermen to increase trips to a maximum of 14,888 trips
Table 4.CPUEand FPI data standardization oflargehead hairtailfishing gear
| Year | Drift Net | Purse Seine | Beach Seine | Hand Line | Liong Bun | |||||
|---|---|---|---|---|---|---|---|---|---|---|
| FPI | CPU | FPI | CPU | FPI | CPU | FPI | CPU | FPI | CPU | |
| 2018 | 1.00 | 18.70 | 0.75 | 14.12 | 0.65 | 12.13 | 0.74 | 13.87 | 0.28 | 5.255396 |
| 2019 | 0.63 | 20.38 | 1.00 | 32.25 | 0.55 | 17.76 | 0.69 | 22.26 | 0.13 | 4.258333 |
| 2020 | 1.00 | 16.92 | 0.23 | 3.86 | 0.74 | 12.57 | 1.91 | 32.33 | 0.75 | 12.71957 |
| 2021 | 1.00 | 25.56 | 0.04 | 0.98 | 0.34 | 8.71 | 0.60 | 15.25 | 0.12 | 3.144737 |
| 2022 | 1.00 | 38.98 | 0.81 | 31.43 | 0.65 | 25.46 | 0.34 | 13.35 | 0.20 | 7.7 |
| 2023 | 0.20 | 22.82 | 1.00 | 114.54 | 0.37 | 42.01 | 0.23 | 26.27 | 0.14 | 16.32143 |
| Average | 0.73 | 23.89 | 1.00 | 32.86 | 0.60 | 19.77 | 0.63 | 20.55 | 0.25 | 8.233243 |
(Source: Processed from statistical data on capture fisheriesfrom theCikidang Fishing Portfor 2018-2023)
Table 5.Comparison ofBiological ParameterDetermination Methods
| Parameter | Calculation Value | Sign Conformity | Conclusion | R square | |||
|---|---|---|---|---|---|---|---|
| Walters-Hilborn Model | |||||||
| r | 0.929436452 | Must be positive | in accordance | ||||
| q | -0.000007 | Must be positive | it is not in accordance with | 0.37 | |||
| K | 498758.95 | Must be positive | in accordance | ||||
| Schnute Model | |||||||
| r | 0.351183631 | Must be positive | in accordance | ||||
| q | 0.00006 | Must be positive | in accordance | 0.038 | |||
| K | 1027596.57 | Must be positive | in accordance | ||||
| CYP Model | |||||||
| r | 0.871627471 | Must be positive | in accordance | ||||
| q | 0.00012 | Must be positive | in accordance | 0.299 | |||
| K | 277083.22 | Must be positive | in accordance | ||||
(Source: Processed from statistical data on capture fisheriesfrom theCikidang Fishing Portfor 2018-2023)
Table 6.Estimation ofSustainablePotential andLevel ofT. lepturusUtilization inPangandaran
| Year | Actual Production | Sustainable Production | Utilization Rate | ||
|---|---|---|---|---|---|
| (kg/year) | (kg/year) | (%) | Status | ||
| 2018 | 98587.43 | 102841.32 | 66.79 | Dense Catch | |
| 2019 | 38671.50 | 44572.64 | 26.20 | Low | |
| 2020 | 24402.06 | 35186.11 | 16.53 | Low | |
| 2021 | 21996.00 | 23783.04 | 14.90 | Low | |
| 2022 | 60272.60 | 39050.06 | 40.83 | Develop | |
| 2023 | 58540.30 | 48201.58 | 39.66 | Develop | |
| average | 50411.65 | 51988.14 | 42.69 | Develop | |
| TAC (kg) | 118,083.83 | ||||
| CMSY (kg) | 147,604.78 | ||||
| EMSY (trip) | 14,888 | ||||
(Source: Processed from statistical data on capture fisheriesfrom theCikidang Fishing Portfor 2018-2023)
Table 7.CalculationResults ofRealInputCosts andReal OutputCostsin theRange 2018-2023
| Real Input Cost | Real Output Cost | |||
|---|---|---|---|---|
| Year IHK | Change | (Rp Million / ton) | (Rp Million / ton) | |
| 2018 | 100 | - | 2.237 | 25,344 |
| 2019 | 92.65 | -7.35 | 0.759 | 23,482 |
| 2020 | 125.88 | 33.23 | 0.581 | 31,904 |
| 2021 | 102.17 | -23.71 | 0.395 | 25,894 |
| 2022 | 93.69 | -8.48 | 0.654 | 23,744 |
| 2023 | 87.46 | -6.23 | 0.832 | 22,166 |
| Average | 100.31 | -2.51 | 0.910 | 25,422 |
(Source: Processed from statistical data on capture fisheriesfrom theCikidang Fishing Portfor 2018-2023)
| Current | MSY | MEY | OAE | ||
| Catch (C) | 50411.648 | 120211.280 | 80349.217 | 117445.073 | |
| Arrest attempt (E) | 2243 | 8686 | 3684 | 7369 | |
| Total revenue (TR) | Rp1,281,586,929 | Rp3,056,063,624 | Rp2,042,672,860 | Rp2,985,739,922 | |
| Total expenditure (TC) | Rp908,728,533 | Rp3,519,651,491 | Rp1,492,869,961 | Rp2,985,739,922 | |
| Economic rent (π) | Rp372,858,395 | -Rp463,587,866 | Rp549,802,899 | Rp0 | |
Table8.StaticOptimizationAnalysisResults ofUtilization ofT.lepturusResourcesinPangandaran
(Source: Processed from statistical data on capture fisheriesfrom theCikidang Fishing Portfor 2018-2023)
with a catch amount allowed of 118,083.83 kg. The amount of catch allowed is 80% of the maximum sustainable catch (CMSY) which is 147,604.78 kg.
3.3.3 Economic Parameter Estimation
Table 7 presents the real input costs and real output costs in the 2018-2023 range using the CPI factor in 2018. The average value of the real input cost of the largehead hairtail resource is IDR0.910 million/ton, with the highest real input cost occurring in 2018 with a value of IDR 2.237 million/ton while the lowest real input cost occurred in 2021 with a value of IDR 0.395 million/ton. The average value of the real output price is IDR1.247 million/ton, with the highest value obtained in 2018 with a value of IDR 2.499 million/ton and the lowest value obtained in 2021 with a value of IDR 0.570 million/ ton. This economic parameter estimate indicates that the average real price of largehead hairtail from 2018 to 2023 is IDR 25,422.44. The Consumer Price Index (CPI) shows that inflation fluctuates each year. An increase in inflation leads to rising operational costs, such as fuel and basic necessities, which can pressure the selling price of fish and negatively impact consumer purchasing power. Conversely, a decrease in inflation can lower operational costs, allowing selling prices to stabilize and maintain consumer demand [17].
3.3.4 Economic Rent Estimation
Static optimization analysis of largehead hairtail resource utilization in Pangandaran was conducted by comparing the economic rent of three management conditions: Maximum Sustainability Yield (MSY), Maximum Economic Yield (MEY), and Open Access (OA). The actual conditions, as compared to these models, are shown in Table 8. The results are as follows:
- (1) MSY: A catch of 120.21 tons per year with 8,686 trips, and an economic rent loss of IDR 463,587,866 annually.
- (2) MEY: A catch of 80.35 tons per year with 3,684 trips, and an economic rent of IDR 549,802,899 annually.
- (3) OA: A catch of 117.45 tons per year with 7,369 trips,
The catch, fishing effort, and economic rent in actual conditions are lower than MSY, MEY, and OA conditions. This indicates that the current condition of largehead hairtail fishery is still not optimal and needs improvement and better utilization. Comparing the economic rent values, it is clear that the MEY management regime yields the highest economic rent.
In MEY conditions, fishing effort is lower than MSY conditions, but the economic rent obtained is greater than that of MSY conditions. The MSY approach is appropriate for stating the maximum catch that can be taken from a fish population without reducing the population's ability to reproduce. The status of fisheries that are still developing does support fishermen to increase their catch by considering MSY. However, on the other hand, increasing production will increase fishing effort. The MSY regime only looks at the biological side, not the economic side. Increasing fishing effort will increase the operational costs of fishing. In this case, fuel costs, basic food costs, and other costs. Therefore, the MEY approach is more appropriate for optimizing the use of largehead hairtail in Pangandaran. The MEY approach not only considers biological factors but also takes into account economic aspects such as operational costs, fish prices, and profits generated from fishing. Through this approach, the maximum catch will be obtained economically and socially [18].
In community-based natural resource management, the active involvement of all levels of society is essential to ensure sustainability. As seen in the Results, the current status of largehead hairtail resource utilization in Pangandaran is categorized as "developing," with a utilization rate of 42.69%. This indicates that the fishery has not yet reached overfishing levels and that there is significant potential for improvement in resource utilization. The findings suggest that fishing efforts could be increased to a maximum of 14,888 trips annually, with a catch of 118,083.83 kg. This would still fall within 80% of the maximum sustainable catch (CMSY), meaning that sustainable fishing practices can support increased fishing activity without negatively affecting the fish population.
The management of largehead hairtail resources requires a balanced approach that considers both biological and economic factors. The Results demonstrate that the Maximum Economic Yield (MEY) regime generatesthe highest economic rent, amounting to IDR 549,802,899 annually, despite having lower fishing effort compared to the Maximum Sustainable Yield (MSY). While MSY is effective for maintaining biological sustainability by indicating the maximum catch that can be taken without impairing the reproductive capacity of the fish population, it does not account for economic factors such as operational costs and fishing effort. This limitation is particularly evident in the Pangandaran fishery, where increased fishing effort under the MSY approach would result in higher operational costs, such as fuel and basic necessities, which ultimately reduce the profitability of the fishery.
The MEY approach not only considers biological sustainability but also integrates economic factors, offering a more balanced and optimal strategy. By considering both biological and economic dimensions, the MEY approach ensures that the fishery remains profitable while maintaining the ecological health of the fish populations, providing longterm stability for both the fishery and the fishermen.
The Results also show that drift nets are the most commonly used fishing gear in Pangandaran. However, while drift nets are more popular, they have lower productivity compared to purse seines, which have the highest catch per unit effort (CPUE). Despite their lower catch rates, drift nets remain the preferred choice for many smaller fishermen due to their lower cost. The purse seine, on the other hand, is the most productive gear for largehead hairtail, making it the recommended standard for optimal resource utilization. However, it is important to consider that adopting purse seines may be challenging for smaller-scale fishermen who lack the necessary infrastructure. Therefore, a solution that balances gear types with appropriate training and access to resources is essential for maximizing productivity across different fishing scales.
Furthermore, fluctuations in inflation, as reflected in the Consumer Price Index (CPI), play a crucial role in determining the operational costs for fishermen. As inflation increases, the cost of essential inputs like fuel and food rises, which pressures the selling price of fish and reduces consumer purchasing power. On the other hand, a decrease in inflation could stabilize operational costs, helping to maintain stable fish prices and support consumer demand. Given this, it is crucial to integrate economic indicators, such as inflation, into fishery management policies to ensure the continued viability and profitability of the sector [17].
In addition to these biological and economic considerations, several key management practices are necessary for sustainable resource use. One critical recommendation is to limit fishing
efforts during the transitional spawning seasons (April–July and October–November). During these times, largehead hairtail are spawning, and fishing during this period could put unnecessary stress on the fish, reduce meat quality, and lower reproductive success. Protecting the fish during these critical periods ensures a sustainable population and helps maintain the ecosystem's balance [19].
The adoption of mesh size regulations, as stipulated in Indonesian regulations, is another key management practice. The proper mesh size for drift nets and purse seines will minimize bycatch, which could otherwise disrupt the marine biodiversity and the overall health of the fishery ecosystem. By adhering to these regulations, fishermen can reduce bycatch and maintain the structural integrity of the ecosystem [20].
Additionally, increasing public awareness about the nutritional value of largehead hairtail, including its high amino acid content, omega-3 fatty acids, and essential minerals like phosphorus, calcium, and iron, can help enhance market demand. Promoting the health benefits of the fish will not only increase its value but also expand the market for both domestic and international consumers.
To support this, improving marketing strategies and enhancing operational efficiencies will further ensure the sustainability and profitability of the fishery. Fishermen's cooperatives can serve as a vital link between fishermen and consumers, adding value, improving product promotion, and expanding customer segments [22].
Finally, in response to CPI fluctuations, enhancing operational efficiency through collective fuel provision, optimizing production processes, and strengthening cooperatives will help mitigate inflation's impact. Strengthening the role of cooperatives will empower fishermen to negotiate better prices and enhance the economic viability of the fishery.
In conclusion, by integrating biological sustainability with economic considerations through the MEY approach and implementing effective management practices such as limiting fishing during spawning seasons and adopting proper gear regulations, largehead hairtail resources in Pangandaran can be managed effectively. These strategies will help ensure the long-term stability of fishery, benefiting both the ecosystem and the local fishing communities.
4. Conclusion
Based on the conducted research, Trichiurus lepturus is a demersal/semi-pelagic fish inhabiting waters at depths of 0 to 100 meters. The spawning season of Trichiurus lepturus occurs between April and July, while the peak fishing season is from October to December. The most productive fishing gear for Trichiuruslepturusisthe purse seine, with the highest average CPUE at 32.86 kg/trip and an FPI of 1. The natural growth of Trichiurus lepturus resources follows an intrinsic
growth rate (r) of 0.872 tons per year, with each increase in fishing effort impacting the stock by 0.00012 tons per trip. The maximum population size in Pangandaran waters is estimated at 277,083 tons. A management regime based on Maximum Economic Yield (MEY) is considered the most sustainable approach, allowing for fishing efforts of up to 3,684 trips per year, yielding a maximum sustainable catch of 80.35 tons annually, and generating an economic rent of IDR 549,802,899 per year.
Sustainable management of Trichiurus lepturus is better implemented with the MEY approach to obtain the greatest benefits while preserving the largehead hairtail population in Pangandaran Waters. In terms of data collection, the Cikidang Fishing Port needs to conduct routine daily recording so that there is no empty data because it will affect capture fisheries statistics. For further research, the more annual data on capture fisheries statistics, the better it will be in describing the actual conditions of fisheries.
Acknowledgements
The author would like to the Cikidang Fishing Port and Department of Marine Affairs, Fisheries, and Food Security (DKPKP) Pangandaran for providing permission and support in collecting data in the field. Furthermore, we would like to thank the School of Life Sciences and Technology at Bandung Institute of facilities and resources. Hopefully, the results of this study can provide benefits for better and more sustainable management of fisheries resources.