
Honey is a natural product with high nutritional and therapeutic value, composed mainly of sugars, organic acids, enzymes, and bioactive compounds such as phenolics and flavonoids. Its quality and stability, however, can be significantly influenced by environmental conditions, botanical origin, and post-harvest processing, particularly thermal treatment. Heating is routinely applied to reduce honey viscosity, delay crystallization, and prevent fermentation, but it can also induce undesirable changes such as color degradation, HMF (hydroxymethylfurfural) formation, and loss of volatile and enzymatic components [1,2].
Kelulut honey, derived from stingless bees (Trigona spp.), has gained increasing attention due to its distinct chemical composition and bioactivity compared to Apis mellifera honey. Kelulut honey, produced by stingless bees (Trigona spp.), has attracted growing interest due to its unique chemical composition and bioactivity compared to A. mellifera honey. It is known for its distinctive sweet–sour taste and fluid texture, 1. Introduction making it more valued than A. mellifera honey. Quantitatively, stingless bee honey contains higher moisture and acidity, slightly lower total carbohydrates, and elevated antioxidant and biological activity levels [3]. Despite its rising popularity and potential health benefits, scientific understanding of how thermal processing affects Kelulut honey's physicochemical integrity remains limited. Prior studies have primarily focused on standard honey varieties, with limited comparative assessments across geographical origins [4,5].
Recent works have highlighted the significant variability in honey properties based on regional floral sources, climate, and soil composition, underscoring the need for locationspecific processing strategies [6,7]. Moreover, parameters like total dissolved solids (TDS), viscosity, HMF content, and acidity are increasingly being recognized as critical indicators of honey quality under thermal stress, yet few studies have systematically assessed these traits in multilocational Kelulut honeys.
Previous studies have examined the effects of heating
1) Department of Biochemistry, Faculty of Mathematics and Natural Sciences, IPB University, Bogor, 16680, Indonesia
2) Halal Science Center, IPB University, Bogor, 16129, Indonesia
Kelulut honey at various temperatures. Heating within the range of 50 °C to 90 °C was found to increase antioxidant properties—such as total phenolic and flavonoid contents and enhance color intensity. However, higher temperatures tend to reduce its antimicrobial activity against certain bacteria [8]. Thermal treatments at 65 °C and 120 °C are used to mimic typical food processing conditions, allowing assessment of the honey's heat stability. Specifically, 65 °C represents mild pasteurization, which helps reduce microbial load while preserving nutritional and functional qualities, whereas 120 °C simulates extreme heat or autoclaving conditions, often used to evaluate the degradation of heat-sensitive compounds. This study addresses this gap by investigating the impact of thermal treatment at 25 °C, 65 °C, and 121 °C for 5 minutes on Kelulut honey from seven distinct Indonesian regions. We analyzed changes in color intensity, total dissolved solids, solubility, viscosity, water content, HMF, and acidity, aiming to (1) evaluate the thermal stability of regional honeys, (2) identify region-specific thermal responses, and (3) provide empirical data to inform safe and effective processing guidelines for Kelulut honey products. Our findings contribute to optimizing quality retention in functional and medicinal honey processing while emphasizing the role of regional biodiversity in determining honey properties.
2. Methodology
The experiment was conducted between December 2021 and March 2022 at the Biochemistry Laboratory, IPB University, Bogor, Indonesia. Kelulut honey samples from seven regions in Indonesia—Serang, Sumedang, Bogor, Batu Ampar, Bangka, Klaten, and Garut—were subjected to thermal treatments at 25 °C (untreated control for baseline comparison), 65 °C, and 121 °C. The aim was to assess changes in physicochemical properties, including color intensity, total dissolved solids (TDS), solubility, viscosity, water content, HMF levels, and acidity. Ten milliliters of each honey sample were placed in test tubes and heated for 5 minutes. The 65 °C treatment was conducted in a water bath, while the 121 °C treatment was performed using an autoclave.
2.1. Color Intensity Test
Honey samples were diluted with distilled water to 50% concentration based on the previous experiment [9]. The solution was centrifuged at 3200 rpm for 5 minutes. Color intensity was measured using a nanospectrophotometer (SPECTROstar Nano BMG LABTECH, Ortenberg, Germany) at an absorbance of 635 nm. The absorbance value is then converted to Pfund scale (mmPfund) to classify the color according to the international honey color grading system.
2.2. TDS test
TDS was measured using a refractometer (% Brix, Digital
Refractometer Sugar Brix, SNDWAY SW593) based on SNI 8664-2018 [10]. One drop of honey sample was placed on the prism, which was then covered and exposed to light. The result was read at the blue line on the white scale.
2.3. Solubility test
The solubility test was measured as the previous method [11]. Five milliliters of water were added to honey in a test tube and mixed using a vortex mixer. Observations continued until the solution became saturated, indicated by visible turbidity.
2.4. Viscosity test
Viscosity was measured using the modified Ostwald method [12]. Distilled water was used as a blank. Water was poured into the viscometer up to the upper mark and released while the stopwatch was started. Time taken to reach the lower mark was recorded. The same procedure was repeated for the honey samples.
2.5. HMF test
The HMF level was measured based on SNI 8664-2018 [10], 5 grams of honey were weighed and transferred into a 50 mL volumetric flask. Distilled water was added to reach a volume of 25 mL. Then, 0.5 mL of Carrez I and 0.5 mL of Carrez II solutions were added to the mixture. The solution was brought to the final volume with distilled water and a few drops of alcohol were added to minimize foam formation. The Carrez I solution was prepared by dissolving 15 g of potassium ferrocyanide (K₄Fe(CN)₆·3H₂O) in 100 mL of distilled water. Carrez II solution was prepared by dissolving 30 g of zinc acetate (Zn(CH₃COO)₂·2H₂O) in 100 mL of distilled water.
The resulting solution was filtered, and the first 10 mL of the filtrate were discarded. Then, 5 mL of the filtrate were pipetted into two separate test tubes. One test tube received an additional 5 mL of distilled water, and the other received 5 mL of 0.2% sodium bisulfite (NaHSO₃) solution. Absorbance was measured at 284 nm for the tube containing distilled water, and at 336 nm for the tube containing NaHSO₃. If the absorbance at 284 nm exceeded 0.6, the sample was diluted appropriately with distilled water (for the sample solution) and 0.2% NaHSO₃ (for the reference solution).
2.6. Acidity determination (SNI 8664-2018)
To determine acidity also based on the SNI 8664-2018 method [10], ten grams of honey were dissolved in 75 mL of carbon dioxide-free water. The solution was stirred using a magnetic stirrer. A calibrated pH meter was inserted, and the solution was titrated with 0.05 M sodium hydroxide (NaOH) until a pH of 8.5 was reached. Afterward, 10 mL of 0.05 M NaOH were titrated immediately with 0.05 M hydrochloric acid (HCl) to reach a pH of 8.3. A blank sample was prepared by titrating 75 mL of CO₂-free water with 0.05 M NaOH under the same conditions.
2.7. Data Analysis
All data were analyzed using SPSS version 24. The experimental design involved a two-factors: (i) heating temperature (65 °C, 121 °C, and including an unheated control, 25 oC) with treatment duration for 5 minutes and (ii) honey regions. The resulting physicochemical parameters were analyzed using two-way ANOVA to assess the effects of temperature, as well as their interaction. Differences were considered significant at p < 0.05. Pearson correlation analysis was used to examine relationships between physicochemical variables. Data are expressed as mean ± standard deviation from triplicate measurements.
3. Results and Discussion
3.1 Thermal impact on color intensity and stability of Kelulut honey
Table 1 shows the color intensity of Kelulut honey from various Indonesian regions evaluated using the Pfund scale at different temperatures. At 25°C, Serang honeys (Serang 1 and 2) exhibited the darkest colors (dark amber), indicating higher pigment content, possibly due to polyphenols or other organic compounds. Bogor honey was lighter (extra light amber), while samples from Bangka, Garut, and Klaten fell into lighter categories (white or water white), reflecting possible differences in floral sources or environmental factors.
At 65°C, most samples significantly lightened, suggesting heat-induced pigment breakdown, possibly involving Maillard reaction products or other heat-sensitive compounds such as polyphenols etc. Serang 1 notably changed from dark amber to water white, and Serang 2 shifted to extra white. Klaten honey exhibited unique behavior, initially becoming lighter but darkening at 121°C, suggesting possible caramelization or Maillard reactions at higher temperatures.
At 121°C, most honeys stabilized at lighter colors, supporting the hypothesis that elevated temperatures degrade pigments. Serang 1 became white, and several others stabilized as extra white. Klaten honey uniquely reversed trend, indicating potential chemical transformations like caramelization under intense heat. Overall, these findings demonstrate that colour intensity in Kelulut honey is highly sensitive to thermal processing, with pronounced regional differences likely influenced by nectar sources and environmental factors.
The two-way ANOVA analysis for TDS showed significant effects for honey type (p = 0.000), temperature treatment (p = 0.000), and their interaction (p = 0.000), all below the 0.05 threshold. This indicates that honey type, temperature treatment, and their interaction significantly influenced the TDS of Kelulut honey from various regions in Indonesia. The multiple determination coefficient (R²) was 0.995, indicating a very strong correlation. The Pearson correlation coefficient between TDS and honey type was 0.333, between TDS and temperature treatment was 0.233, and between TDS and color
intensity was 0.233—all indicating low correlations.
3.2. Temperature-induced changes in total dissolved solids (TDS)
The TDS measured in % Brix (Figure 1), varied significantly across regions at 25°C, from 76.0% (Serang 2) to 78.3% (Klaten), reflecting differences in moisture and solute concentration. At 65°C, a general increase in TDS was observed, likely due to moisture evaporation. For example, Serang 1 increased from 77.0% to 78.7%, and Bogor rose from 77.0% to 79.5%. However, Bangka uniquely showed a slight TDS reduction, indicating atypical thermal sensitivity.
At 121°C, many samples, including Garut (80.0%), reached their maximum TDS, indicating substantial moisture loss and solute concentration. Bangka again defied this trend, decreasing significantly to 74.0%, possibly due to thermal decomposition or loss of volatile components. Batu Ampar honey remained stable at 78.0% across all temperatures, indicating high thermal stability. The data underscores the importance of regional composition on TDS response, crucial for processing consistency in food and medicinal applications. The two-way ANOVA analysis for TDS showed significant effects for honey type (p = 0.000), temperature treatment (p = 0.000), and their interaction (p = 0.000), all below the 0.05 threshold. This indicates that honey type, temperature treatment, and their interaction significantly influenced the TDS of Kelulut honey from various regions in Indonesia. The multiple determination coefficient (R²) was 0.995, indicating a very strong correlation. The Pearson correlation coefficient between TDS and honey type was 0.333, indicating a low correlation. The correlation between TDS and temperature treatment was 0.233, and between TDS and color intensity was also 0.233, both showing low correlations.
3.3. Effect of temperature on honey solubility
The solubility of Kelulut honey demonstrates a clear dependence on temperature, with the most notable increase occurring at 65 °C (Figure 2). Across all regions, honey samples generally exhibited a substantial improvement in solubility when heated from 25 °C to 65 °C. This enhancement was notable changes in Serang 1, Sumedang, and Garut, possibly due to crystallized sugar dissolution or increased molecular mobility. These trends suggest that moderate heating helps dissolve honey constituents more effectively, possibly due to the breakdown of certain crystallized sugars or enhanced molecular movement.
However, when samples were exposed to 121 °C, a noticeable drop in solubility was observed for most regions. In many cases, the solubility at 121 °C was close to or slightly higher than the initial solubility at 25°C, but significantly lower than the peak seen at 65°C. This decline could be attributed to the degradation of honey components or the formation of insoluble compounds at high temperatures. For
| Honey regions | Color Intensity | ||
|---|---|---|---|
| 25 °C | 65 °C | 121 °C | |
| Serang 1 | Dark Amber | Water White | White |
| Serang 2 | Dark Amber | Extra White | Extra Light Amber |
| Bogor | Extra Light Amber | Extra White | Extra White |
| Bangka | White | White | White |
| Batu Ampar | Extra Light Amber | Extra White | Extra White |
| Sumedang | Water White | White | Extra White |
| Garut | White | White | Extra White |
| Klaten | White | Water White | Light Amber |
Table 1.Colorintensity testresults and Pfund scale interpretation ofKelulut honey
instance, Serang 1 dropped from 84.7 at 65 °C to just 22.7 at 121 °C, while Garut and Sumedang similarly regressed to around 22.7 and 23.3, respectively. The standard deviations at 121 °C were also relatively high in some regions, suggesting inconsistent results possibly due to chemical changes in honey structure under extreme heat.
Interestingly, not all regions followed this exact pattern. For example, Bangka displayed a gradual increase in solubility across all three temperatures, peaking at 30 at 121°C—its highest recorded value. On the other hand, Serang 2 remained quite low in solubility across all conditions, with only a slight increase at 121°C. This variation might reflect differences in honey composition due to floral source, regional climate, or bee species behavior. In addition, Pearson correlation analysis was conducted to examine the relationship between the solubility of Kelulut honey and other physicochemical properties.
The two-way ANOVA analysis for solubility showed significant effects for honey type (p = 0.000), temperature treatment (p = 0.000), and their interaction (p = 0.000), all below the 0.05 threshold. This indicates that honey type, temperature treatment, and their interaction significantly influenced the solubility of Kelulut honey from various regions in Indonesia. The multiple determination coefficient (R²) was 0.963, indicating a very strong correlation. The Pearson correlation coefficient between solubility and moisture content was -0.325, indicating a low negative correlation, while the correlation between solubility and viscosity was 0.298, indicating a low positive correlation.
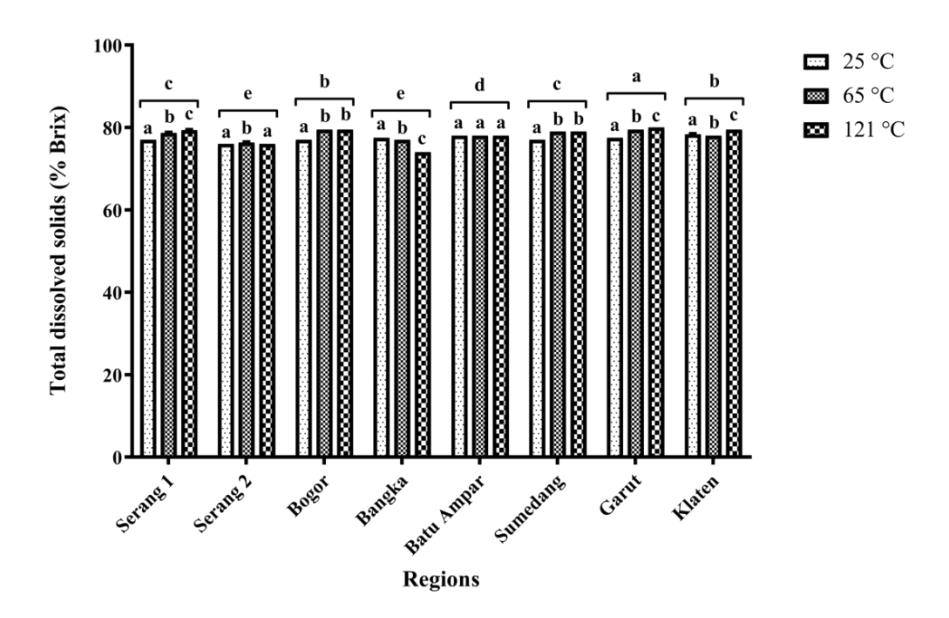
Figure 1.Total dissolved solids ofKelulut honey before and after heating, expressed in % Brix. Different lowercase letters(a-d)indicate statistically significantdifferences(p<0.05)based onTukey'spost-hoc testfollowing two-wayANOVA
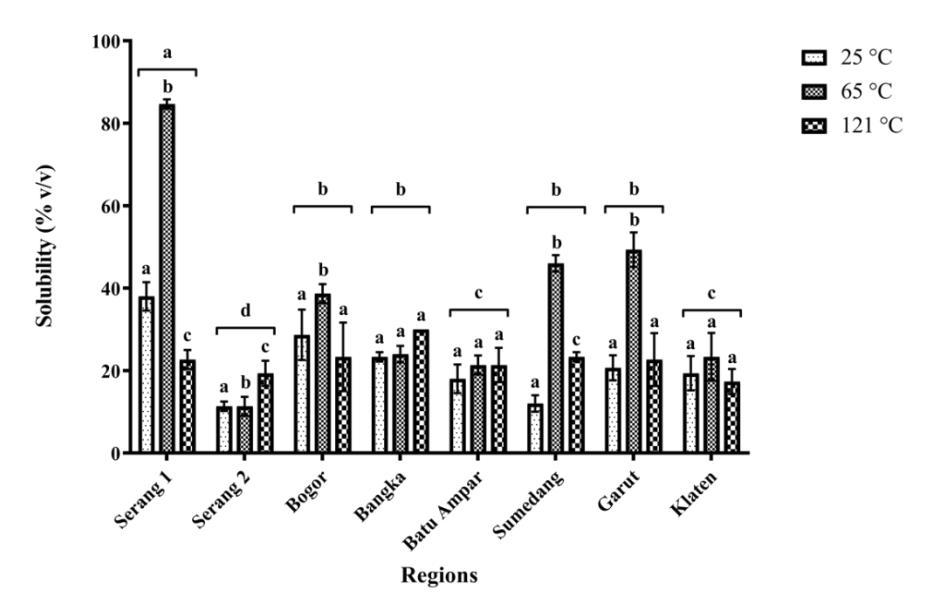
Figure 2.Effect oftemperature on the solubility of Kelulut honey across differentregions, standard deviation wasfromtriplicate experiments. Differentlowercase letters(a-d)indicate statistically significant differences(p<0.05)based onTukey'spost-hoc testfollowing two-way ANOVA
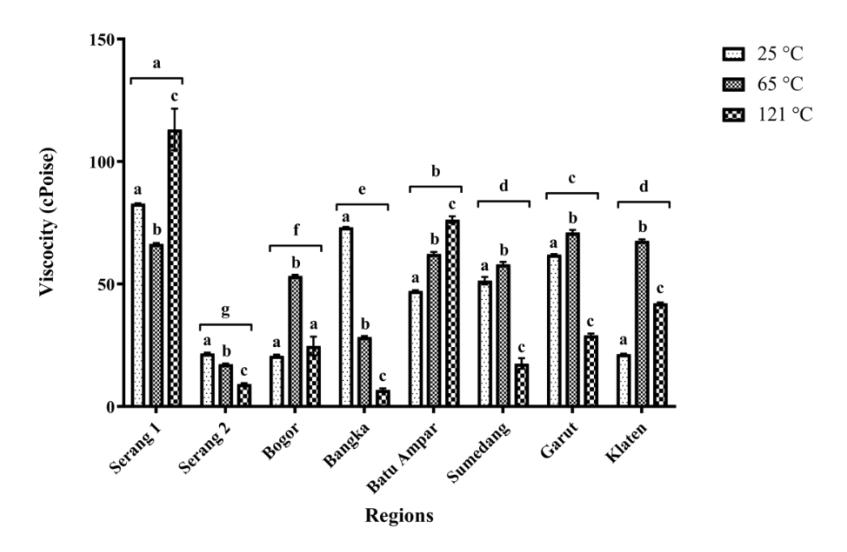
Figure 3.Impact ofthermal treatment on the viscosity of kelulut honey fromvariousregions,standard deviationwasfromtriplicate experiments.Differentlowercase letters(a-g)indicate statistically significant differences(p<0.05)based onTukey'spost-hoc testfollowing two-wayANOVA.
3.4. Impact of thermal treatment on honey viscosity
Initial viscosity varied widely (47.6 average), with Serang 1 and Bangka having thicker consistencies, whereas Bogor and Klaten were thinner (Figure 3). At 65°C, viscosity typically decreased, aligning with expected thermal thinning, although Bogor, Batu Ampar, Garut, and Klaten increased unexpectedly, possibly from compositional changes such as crystallization breakdown. At 121°C, viscosity responses diverged: Serang 1 and Batu Ampar thickened significantly, possibly due to caramelization, while Bangka and Serang 2 thinned considerably, indicating structural breakdown. This variability underscores the necessity of characterizing regional honeys individually before thermal treatment.
The two-way ANOVA analysis for viscosity showed significant effects for honey type (p = 0.000), temperature treatment (p = 0.000), and their interaction (p = 0.000), all below the 0.05 significance threshold. This indicates that honey type, temperature treatment, and their interaction significantly influenced the viscosity of Kelulut honey from different regions in Indonesia. The multiple determination coefficient (R²) was 0.996, indicating a very strong correlation. The Pearson correlation between viscosity and TDS was 0.398, indicating a low correlation, while the correlation between viscosity and moisture content was 0.491, indicating a moderate correlation.
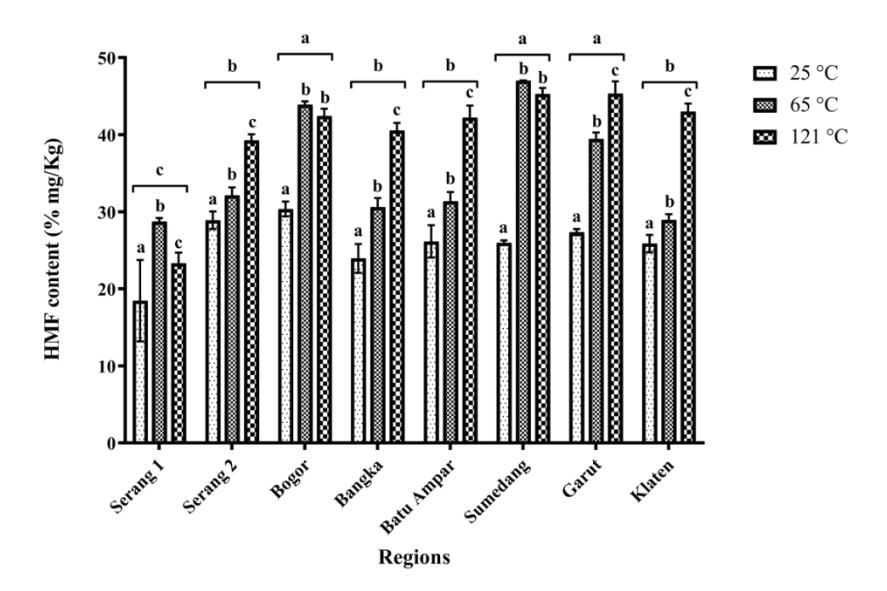
Figure 4.Effect ofheattreatmentonHMFformation in Kelulut honey fromdifferentregions,standard deviationwasfromtriplicate experiments.Differentlowercase letters(a-c)indicate statistically significant differences(p<0.05)based onTukey'spost-hoc testfollowing two-wayANOVA.
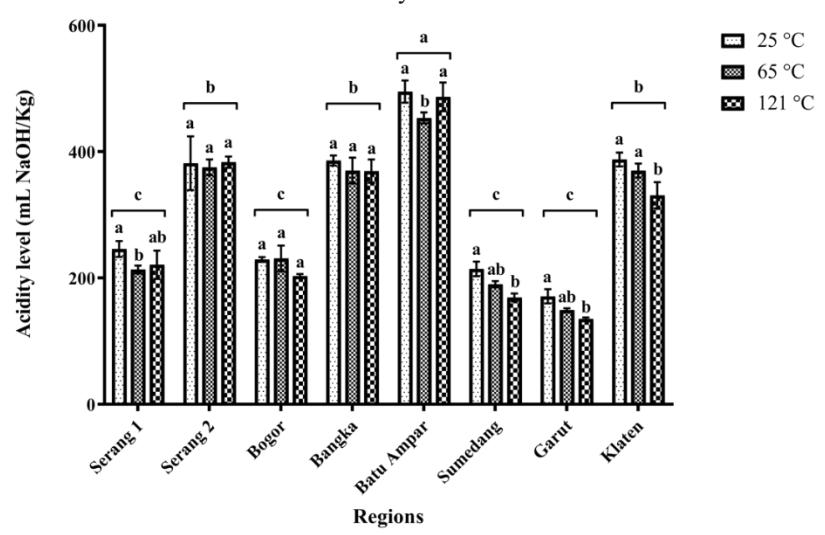
Figure 5.Effect of heat on the acidity of Kelulut honey acrossregional variants,standard deviation wasfromtriplicate experiments. Different lowercase letters(a-c)indicate statisticallysignificantdifferences(p<0.05)basedonTukey'spost-hoctestfollowingtwo-wayANOVA.
3.5. Thermal-induced hydroxymethylfurfural (HMF) variations
The HMF content, an important indicator of honey quality and heat exposure, showed a clear increasing trend with temperature, confirming the expected thermal response of honey. At 25 °C, the average HMF concentration across regions was 25.91 mg/kg, which rose to 35.28 mg/kg at 65 °C and further to 40.16 mg/kg at 121 °C (Figure 4). This progressive increase strongly suggests that heating promotes HMF formation, likely due to the Maillard reaction and sugar degradation.
Among the samples, Bogor and Sumedang had the highest HMF levels after heating, with Bogor reaching 43.9 mg/kg at 65 °C and 42.4 mg/kg at 121 °C, while Sumedang peaked at 47.0 mg/kg and 45.3 mg/kg, respectively. These high values suggest that the honeys from these regions may be more prone to thermal decomposition or contain precursor compounds that accelerate HMF generation. Conversely, Serang 1 had the lowest HMF values, increasing modestly from 18.5 to 28.7 mg/kg at 65 °C, then slightly dropping to 23.3 mg/kg at 121 °C, which is an unusual pattern possibly influenced by evaporation or sample loss.
Interestingly, while most regions showed a consistent increase from 25 °C to 121 °C, a few—Serang 1 and Bogor showed a slight decrease in HMF levels at the highest temperature compared to 65 °C. This may indicate some level of HMF degradation or volatility at extreme heat. However, for most other regions like Garut, Klaten, and Batu Ampar,
HMF continued to rise with increasing temperature, consistent with standard expectations. Overall, this analysis confirms that heating significantly increases HMF levels in Kelulut honey, with values varying depending on the origin. This has important implications for honey processing and storage, as excessive HMF can be a marker of quality degradation and overprocessing.
The two-way ANOVA analysis for HMF content showed significant effects for honey type (p = 0.000), temperature treatment (p = 0.000), and their interaction (p = 0.000), all below the 0.05 threshold. This indicates that honey type, temperature treatment, and their interaction significantly influenced HMF levels in Kelulut honey from various regions in Indonesia. The multiple determination coefficient (R²) was 0.978, indicating a very strong correlation. Pearson correlation analysis showed that HMF had a low correlation with honey type (r = 0.282), viscosity (r = 0.373), color intensity (r = 0.279), and acidity (r = 0.235). In contrast, HMF showed a high correlation with both temperature treatment (r = 0.681) and TDS (r = 0.681).
3.6. Regional differences in acidity changes upon heating
Heating generally causes a decrease in the acidity levels of Kelulut honey across most regions. The reduction becomes more pronounced at the higher temperature of 121°C, indicating that intense heating has a more significant impact on acidity. However, the extent of this effect varies greatly depending on the region, suggesting that local environmental factors or floral sources may influence the honey's thermal stability (Figure 5).
Sumedang and Garut experienced the most substantial decline in acidity. In Sumedang, acidity dropped by approximately 11 % at 65 °C and further plummeted by over 21 % at 121 °C. Similarly, Garut showed a decrease of around 12.7 % at 65 °C, escalating to nearly 21% at 121 °C. This suggests that honey from these regions is more sensitive to heat and may undergo greater chemical transformations when exposed to high temperatures.
Klaten also showed a notable decrease, particularly at 121 °C, where acidity dropped by around 14.6%, highlighting a similar susceptibility to heat-induced changes. Interestingly, Serang 2 and Bogor demonstrated minimal or even positive percentage changes. Serang 2 showed a very slight decrease at 65°C (around -1.8 %) and a marginal increase at 121 °C (approximately +0.4 %), suggesting exceptional resistance to heating. Similarly, Bogor showed a small increase at 65 °C but a decrease at 121 °C by about 11.4 %, reflecting some variability but still relatively stable. The analysis reveals that heating affects the acidity of Kelulut honey in a regionspecific manner. Honeys from Sumedang, Garut, and Klaten are more heat-sensitive, while those from Batu Ampar, Serang 2, and Bangka retain their acidity levels better under thermal
stress. This insight could be important for processing and preserving honey, particularly when targeting nutritional or medicinal uses where acidity plays a role.
The two-way ANOVA analysis for acidity showed significant effects for honey type (p = 0.000), temperature treatment (p = 0.000), and their interaction (p = 0.002), all below the 0.05 threshold. This indicates that honey type, temperature treatment, and their interaction significantly influenced the acidity of Kelulut honey from various regions in Indonesia. The multiple determination coefficient (R²) was 0.986, indicating a very strong correlation. The Pearson correlation coefficient between acidity and solubility was 0.394, indicating a low correlation.
The results clearly illustrate that thermal processing significantly affects various physical and chemical properties of Kelulut honey, underscoring the importance of understanding regional differences for optimal processing and storage conditions. Color intensity was notably sensitive to temperature changes, indicating that heating significantly alters honey pigmentation, likely due to the degradation of pigments such as polyphenols and Maillard reaction products [13,14]. Notably, Klaten honey displayed a unique thermal response, initially lightening before darkening at higher temperatures, indicating complex chemical changes such as caramelization under intense heat [15]. The Maillard reaction—a non-enzymatic browning process between reducing sugars and amino acids—produces melanoidins that contribute to the brown color. These findings emphasize the importance of carefully controlling thermal treatments to preserve the honey's visual appeal and potentially its nutritional value.
Moisture evaporation during heating reduces the water content in Kelulut honey, thereby concentrating the remaining solutes—such as sugars, minerals, and organic acids. This concentration effect increases the total dissolved solids (TDS), as the same ammount of solutes becomes more densely packed in a smaller volume of liquid, but regional variability was evident. The atypical decrease in Bangka honey at high temperatures suggests unique compositional sensitivities, possibly involving volatile compound loss or decomposition [6,7]. These observations emphasize the significance of region-specific compositional factors in processing Kelulut honey, particularly in products where consistent sweetness and density are critical.
Solubility improvements observed at moderate heating (65 °C) provide practical implications for processing honey into products where easy dissolution is advantageous. However, the sharp decline in solubility at extreme temperatures indicates potential degradation or insoluble compound formation, emphasizing that overly intense thermal exposure can negatively impact honey quality [1]. Bangka's
progressive increase in solubility across all temperatures suggests exceptional compositional stability, warranting further exploration into its unique biochemical makeup.
Viscosity changes due to heating showed considerable regional differences, suggesting variability in honey's biochemical and physical makeup. Increased viscosity at high temperatures, as seen in some regions, could be linked to caramelization or crystallization breakdown, affecting processing techniques and end-product consistency. Therefore, region-specific characterizations of viscosity behavior should guide thermal treatments for maintaining desired textures and functionalities in culinary and pharmaceutical applications.
The remarkable thermal stability of water content across most regions supports Kelulut honey's viability for various commercial uses, given moisture stability's critical role in determining shelf life and quality preservation [16]. The slight variations observed in regions like Bangka may reflect external factors rather than intrinsic honey properties, reinforcing the importance of standardized and careful measurement practices during thermal processing.
HMF levels predictably rose with temperature, serving as a reliable indicator of thermal exposure and honey quality deterioration. Notably, certain regions displayed atypical HMF trends, suggesting differential susceptibilities to thermal degradation [2,17]. These variations necessitate careful control of heating processes to maintain nutritional integrity and comply with quality standards, particularly in therapeutic contexts.
Lastly, acidity changes further illustrate regional differences in honey's chemical stability under heat. Significant declines in acidity in regions like Sumedang and Garut indicate greater susceptibility to heat-induced chemical changes. In contrast, minimal acidity variations in regions like Bangka, Batu Ampar, Serang 2, and Bogor reflect inherent chemical stability, favorable for processing methods requiring sustained acidity levels. Overall, these results emphasize the critical role of regional and compositional variability in determining Kelulut honey's response to thermal processing, guiding producers and manufacturers toward informed decisions to maximize quality and functionality in various applications.
The two-way ANOVA revealed significant interaction effects between region and temperature across all measured parameters, indicating that the impact of thermal treatment is strongly influenced by the honey's geographical origin. This suggests that processing guidelines may need to be regionspecific to preserve honey quality. Additionally, temperature had a pronounced effect on HMF and viscosity levels, reinforcing their value as thermal degradation indicators. Pearson correlation analysis further supported these findings: viscosity showed a strong positive correlation with TDS, highlighting the role of dissolved solids in determining flow behavior, while HMF negatively correlated with acidity, suggesting that acid loss during heating facilitates HMF
formation. Together, these results suggest that HMF, viscosity, and TDS may serve as reliable markers for assessing the extent of thermal processing in honey.
4. Conclusion
This study reveals region-specific thermal responses in Kelulut honey from Indonesia. Moderate heating (65 °C) enhances solubility and increases TDS, while hightemperature treatment (121 °C) significantly elevates HMF levels and alters viscosity and acidity. Klaten honey exhibited unusual color darkening at high heat, whereas Bangka honey remained stable in solubility and acidity. These variations highlight the need for region-specific processing protocols to maintain the quality and bioactivity of Kelulut honey. Overall, thermal processing markedly affects key physical and chemical properties, underscoring the importance of carefully controlling heating conditions to preserve the aesthetic, nutritional, and functional qualities of the final product. Twoway ANOVA confirmed significant interactions between region and temperature, indicating that honey's thermal response is region-dependent. Strong correlations between parameters—such as HMF and acidity, and viscosity and TDS—highlight potential indicators of thermal degradation. These findings suggest that region-specific processing standards may be necessary to preserve honey quality, and that HMF, viscosity, and TDS could serve as reliable markers for assessing thermal effects in honey.
Acknowledgements
We gratefully acknowledge the late Prof. Dr. AE Zainal Hasan, M.Si., for his scientific insights and financial support that contributed significantly to this research.