
1. Introduction
The history of the Pulau Dua Nature Reserve began when the archipelago was still under Dutch colonial rule. At that time, Pulau Dua was still separated from Java, so only 8 hectares were counted as the Pulau Dua Nature Reserve. Over time, a mud pile formed, uniting Pulau Dua with Java that reported in 1978. After that, the mud pile was overgrown with Avicennia marina, which then became the dominant plant species in the Pulau Dua Nature Reserve [1]. In fact, the original mangrove found in the Pulau Dua area when it was still separated from Java Island was Rhizophora sp. That land changes indicates that physical and chemical changes, such as the emergence of lands, can have a significant impact on the composition of vegetation in the Pulau Dua Nature Reserve.
Changes in vegetation composition driven by physical and chemical processes in the Pulau Dua area affect not only the structure of the ecosystem but also the biodiversity that depends on it. One of the key components of this ecosystem is the bird population. Vegetation plays a crucial role in supporting bird life by providing nesting sites, food sources, and shelter [1]. Therefore, the physical and chemical transformations within the Pulau Dua Nature Reserve influence not only land formation and plant structure but also have direct and indirect impacts on the birds inhabiting the area. Known as "Bird Island," Pulau Dua serves as a vital habitat for thousands of birds, particularly waterbirds.
Plastic waste found scattered around the Pulau Dua Nature Reserve is one of the threats that can disrupt the habitat of the birds there [2]. The proportion of plastic waste cover that coversthe mangrove seedling area can cause various problems, such as disrupting the absorption of light, dissolved oxygen, and nutrients. These disturbances can lead to a decline in the quality of vegetation seedlingsin polluted mangrove areas [3]. Several problems mentioned previously suggest that plastic waste is becoming a significant issue in the Pulau Dua Nature Reserve. The plastic waste is indicated to affect the physical and chemical characteristics of the Pulau Dua Nature Reserve so that it can affect the ecosystem there. Therefore, this study aims to determine the physical and chemical characteristics of the Pulau Dua Nature Reserve, as well as to determine the relationship between the proportion of plastic waste cover and the physical and chemical parameters of the Pulau Dua Nature Reserve.
2. Methodology
Field data collection was carried out in two stages. The first stage of data collection was carried out from September 28, 2023, to September 30, 2023. The second stage of data collection was carried out from October 13, 2023, to October 14, 2023. Field data were taken at the Pulau Dua Nature Reserve, Sawah Luhur Village, Kasemen District, Serang City, Banten Province, Indonesia. The study area is limited by coordinates 6°0'54.457"S - 6°1'32.312"S and 106°11'9.287"E - 106°12'9.074"E. Soil sample processing and data analysis were conducted at Labtek VA, Jatinangor Campus, Bandung Institute of Technology, Jalan Let. Jen. Purn. Dr. (HC). Mashudi No. 1, Sumedang, West Java, Indonesia, with coordinates 6°55'53.41"S and 107°46'15.90"E. The field data and sample processing were analyzed using two approaches, comparison based on literature review and previous studies with mangrove ecosystems, and statistical methods used are correlation and real difference test.
The tools used in data collection are a refractometer, soil tester for soil pH and moisture, soil core sampler, multiparameter microclimate sensor (air temperature, air humidity, light intensity, and air speed), tagging coordinate application (Avenza Maps), and a plot of 50 cm × 50 cm (10 cm × 10 cm × 25) PVC pipe (can be seen in Figure 1). Meanwhile, the tools used in processing soil samples include an oven and aluminum foil paper. The device used application for spatial processing (ArcMap) and statistical analyze (Excel). The materials in data processing use the boundary map of Pulau Dua Nature Reserve.
The physical and chemical characteristic data consist of the proportion of plastic waste cover (%), air temperature (°C), air humidity (%), light intensity (lux), air speed (km/h), soil pH, soil moisture (%), water salinity (%), and soil samples to obtain bulk density data (gr/cm3), soil porosity (%), soil water content (% w/w), and soil texture. The physical and chemical data for each characteristic were taken using systematic random sampling, except for water salinity data. Systematic random sampling was carried out by assigning each point a distance of 100 m in the direction of the wind from North to South and East to West. The selection of 100 m distance is expected to be able to select points that represent every 1 hectare or 10,000 m2 of the area of the Pulau Dua Nature Reserve as well as every layer of the mangrove ecosystem within it. The use of the systematic random sampling method aims to reduce sampling error in data collection results [4]. The number of points obtained was 34 points, as shown in Figure 2. Meanwhile, water salinity data were collected using accidental sampling. This is because encounters with standing water cannot be found at every point in the Pulau Dua Nature
Figure1.Plot ofPVCPipeSize50 cm×50 cm
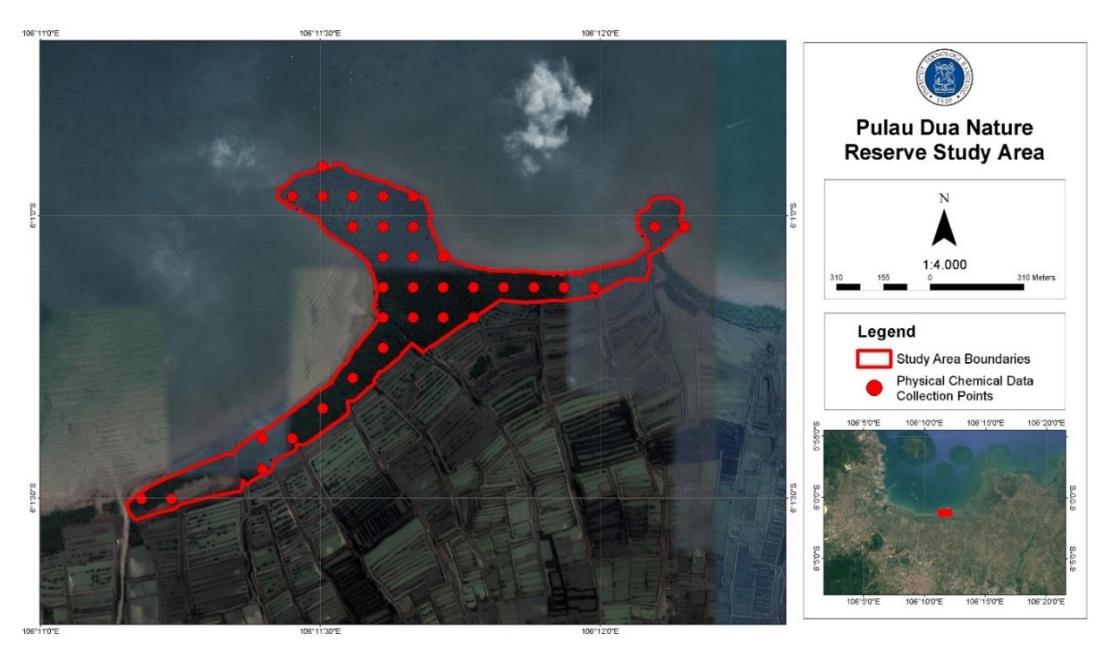
Figure 2.Pulau Dua NatureReserve StudyAreaWork Plan Map
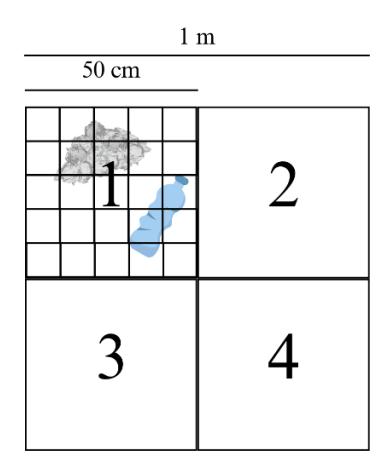
Figure 3.Illustration ofthe Placement ofthe PVCPipe Plot inTaking OnePoint ofthe Proportion ofPlasticWasteCover
Reserve during the dry season, so it is necessary to utilize chance encounters when collecting data in the field [5].
Data collection on the proportion of plastic waste cover was carried out by placing the PVC pipe plot on the ground surface four times, with overlapping positions next to each other between the placements, as illustrated in Figure 3. The percentage calculation is based the number of fulfillments of the 10 cm × 10 cm box. Each fulfillment of one 10 cm × 10 cm box is interpreted as a proportion of 1% of plastic waste cover from a sample area of 1 m2 .
Data collection of air temperature, air humidity, and light intensity was recorded at average in one minute. Meanwhile, for wind speed data, the maximum value was recorded over a one minute. The time for collecting the microclimate data was taken only at the estimated extreme weather time of one day, namely within the time range of 10:00 am – 3:00 pm. This is because the characteristics of the microclimate tend to be stable at that time [6]. Meanwhile, data collection of pH and soil moisture was carried out after the soil tester was attached to the sampling point for one minute. Apart from data collection that included microclimate, no specific collection time was specified.
Comparative Analysis
Each parameter that has been measured will be determined its maximum, minimum, and average value with standard deviation. From the maximum and minimum values, the range of each parameter will be obtained. The use of the range value of each parameter can make it easier to compare data, both with other locations and from established standards [7]. However, the average and standard deviation would provide a better explanation and support the range of maximum and minimum values shown.
Correlation Test Analysis
All physical and chemical characteristic data obtained by systematic sampling method and having interval and ratio data types were tested with correlation test in the form of Pearson Correlation Matrix. The matrix is useful to show the strength of linear relationship between two variables [8]. Data that is included in interval data type is air temperature and soil pH. While data that is included in ratio data type that can be tested for Pearson Correlation Matrix is air humidity, light intensity, air speed, soil moisture, bulk density data, soil porosity, soil water content, and plastic waste cover proportion itselve. Then, the correlation value from every physical and chemical characteristics with plastic waste cover proportion will be analyzed further. The correlation formula used in this study for Pearson Correlation Matrix is shown in equation (1) [9].
\[r_{xy} = \frac{n\sum xy - (\sum x)(\sum y)}{\sqrt{[n\sum x^2 - (\sum x)^2][n\sum y^2 - (\sum y)^2]}}\] with: (1)
r_xy : correlation between variables x and y
x : first variable y : second variable
n : number of observations
Real Difference Test Analysis
The difference test is conducted by testing the plastic waste proportion parameters divided into several classes based on selected physical and chemical parameters. The selected parameters are selected based on the highest correlation value among the other parameters. The division of selected parameter classes will be carried out purposively. The test used is the Independent Sample T-test which will compare the t value of the data calculation with the t table. If the t calculation is smaller than the t table, then the two data are considered not significantly different. Likewise, if the t calculation is greater than the t table, then the two data are considered significantly different [10]. The confidence interval value used is 95%. The formula used to calculate the t calculation between two data is shown in equation (2). Meanwhile, to determine the t table, the degrees of freedom of the two groups of data are used as shown in equation (5).
\[t = \frac{\overline{X}_1 - \overline{X}_2}{\sqrt{\frac{s_1^2}{n_1} + \frac{s_2^2}{n_2}}} \tag{2}\]
\[s_1^2 = \frac{\sum (X_1 - \overline{X}_1)^2}{n - 1} \tag{3}\]
\[s_2^2 = \frac{\sum (X_2 - \bar{X}_2)^2}{n - 1} \tag{4}\]
\[dk = n_1 + n_2 - 2 (5)\] with:
t : t coefficient X̅ : sample mean
s :sample standard deviation n : number of sample data dk : degrees of freedom
3. Result and Discussion
The characteristics of water salinity obtained by accidental sampling amounted to 13 points located on the river flow to the sea, sea, and puddles, which can be seen in Figure 4. Meanwhile, some light intensity data on open land cannot be measured due to the capacity of the tool. However, from previous studies, it was stated that open land has a light intensity of ±100000 lux [11].
(1) 3.1 Plastic Waste Cover Proportion
The data is presented in Table 1 for the proportion of plastic waste cover compared to mangrove forests on the North coast of Central Java shows the same maximum proportion of plastic waste cover. A significant amount of plastic waste cover is caused by plastic waste that is often trapped in the upper sediment layer, which can lead to a prolonged decrease in oxygen content [12].
3.2 Soil Characteristics
The field data for soil pH showed that the mangrove soil conditions tended to be neutral for mangrove soil with average value 6.27±0.76. This result have similarity condition with data on mangrove vegetation in Wonomulyo District, Polewali Mandar Regency [24]. However, the pH value tends towards acid. The activity of soil microorganisms in decomposing litter is optimal at a neutral acidity level, and a low pH can slow down the decomposition of the litter [13].
The high soil moisture in the Pulau Dua Nature Resource, with average value 82.35±38.70%, were quite following the criteria for tropical forests [14]. Soil moisture parameters show quite good parameters when compared with mangrove in Sebubus Village, which has lower soil moisture. Meanwhile, the low data in the Pulau Dua Nature Reserve could be due to its position, which is close to the coast, so it is frequently affected by sea winds [14].
The bulk density field data showed results with a more extensive range data with average value 0.59±0.24, both in terms of minimum and maximum limits. The bulk density field data indicates human activity, same like the high bulk density value in Bone Bay is attributed to mangrove logging activities in the area. Apart from human footholds that are active there, the remaining litter left behind causes the flow of water to the soil to be obstructed, and the soil will become more compact [16]. The high bulk density value can make it difficult for roots to penetrate the soil [17]. This can be a factor
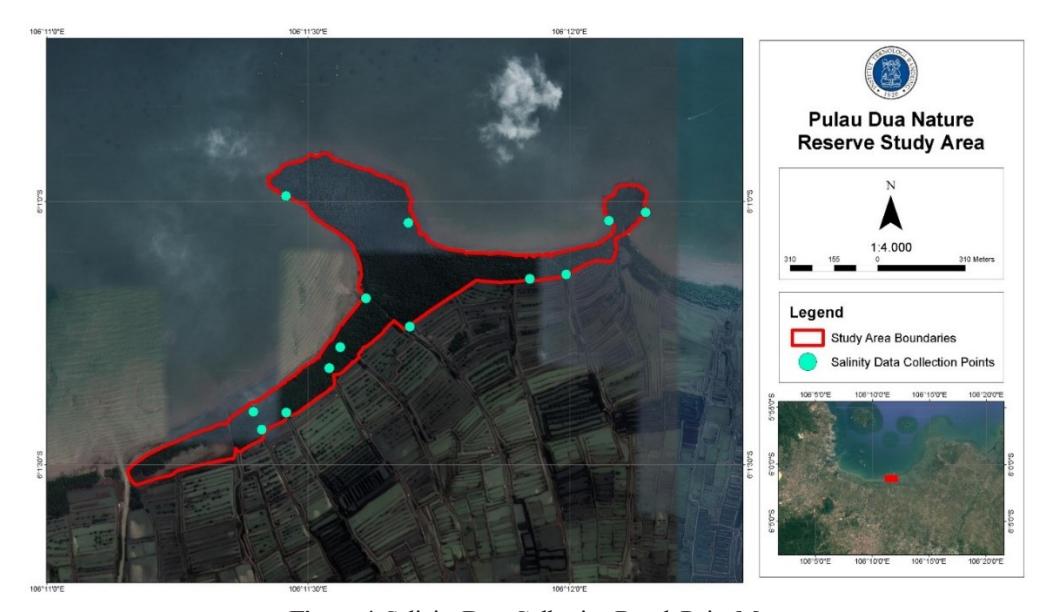
Figure 4. Salinity DataCollection Result Point Map
in the difficulty of mangrove vegetation growing in the Pulau Dua Nature Reserve.
Soil porosity data tend to be higher with average value 77.67±9.21. High soil porosity can also indicate a high organic matter content [16]. The high soil porosity also demonstrates the soil's ability to capture large amounts of water [16]. Meanwhile, the soil texture taken in the field is note significant different from that in Bone Bay. The difference between the two locations is that the soil texture in the Pulau Dua Nature Reserve is more clay. Clay soil texture has a limited distribution of vegetation types because not many plant types can grow in soil with that texture [18].
The soil water content data in the Pulau Dua Nature Reserve tends to be higher with average value 90.29±77.66%
w/w. The characteristics of soil that is always wet with high water content, even to the point of water saturation, are characteristics of mangrove soil [19]. This makes the Pulau Dua Nature Reserve have water content parameters that are suitable for the mangrove ecosystem even though it is the dry season.
3.3 Microclimate Characteristic
The air temperature field data tended to be higher with average data 36.00±2.88°C. However, the data in the reference showed that the temperature was no longer suitable for Avicennia marina vegetation, as the vegetation has an optimal growing temperature range of 18°C to 20°C [15]. This could pose a threat to the Pulau Dua Nature Reserve, which has a
Table 1.Comparison of each PhysicalChemical Parameter withMangroveEcosysteminDifferent Places
| Physical and Chemical Parameters | Results of Field Data Collection | Average Field Data | Standard Deviation | Reference Data |
|---|---|---|---|---|
| Waste Cover Area (%) | 0 – 50 | 3.15 | 8.56 | ≤ 50 [12] |
| Soil pH | 4.5 – 7.5 | 6.27 | 0.76 | 4.7 – 6.7 [24] |
| Soil Moisture (%) | 0 – 100 | 82.35 | 38.70 | 30 – 33 [14] |
| Bulk Density (gr/cm3 ) | 0.22 – 1.18 | 0.59 | 0.24 | 0.55 – 0.78 [16] |
| Soil Water Content (%) | 0.56 – 274.29 | 90.29 | 77.66 | 30.63 – 47.36 [25] |
| Soil Porosity (%) | 55 – 91 | 77.67 | 9.21 | 36 – 77 [16] |
| Light Intensity (lux) | 1822 – 100000 | 22074.03 | 33111.61 | 412 – 83559 [20] |
| Wind Speed (km/jam) | 0.00 – 15.30 | 2.51 | 4.46 | 0.00 – 1.44 [21] |
| Air Temperature (°C) | 32.6 – 45.8 | 36.00 | 2.88 | 25.7 – 28.6 [14] |
| Air Humidity (%) | 42 – 75 | 62.16 | 8.56 | 70 – 78 [21] |
| Water Salinity (‰) | 33 – 54 | 39.69 | 7.35 | 30 – 35 [22] |
| Soil Texture | Sand, Loamy Sand, Sandy Loam, Silt Loam, Clay | - | - | Sandy-Clay Loam, Clay Loam, Clay [16] |
dominant vegetation of Avicennia marina and a temperature that tends to be higher than the reference data.
Light intensity field data tend to be higher with average value 22074.03±22111.61 lux. Light intensity significantly affects seedling growth. The higher the light intensity entering the forest floor, the faster the growth of seedling in the area [20]. This indicates that the light intensity parameters in the Pulau Dua Nature Reserve support the growth of mangrove seedlings there.
The air humidity field data from the Pulau Dua Nature Reserve tends to be lower, with average value 62.16±8.56%, compared to the mangrove area in Muara Aluh-aluh. High air humidity can reduce the availability of nutrients for plants due to decreased transpiration rates [21]. Meanwhile, the wind speed in the Pulau Dua Nature Reserve is higher, with average value 2.51±4.46 km/h, than that in Muara Aluh-aluh. The low wind speed can be attributes the density of mangrove vegetation, which causes the wind speed to decreases [21]. This indicates that the Pulau Dua Nature Reserve has greater potential to provide nutrients for mangrove plants compared to Muara Aluh-aluh. However, the wind speed data field indicates that the Pulau Dua Nature Reserve has a lower mangrove vegetation density than Muara Aluh-aluh.
3.4 Water Salinity Condition
Water salinity field data tend to be higher, with 39.69±7.35‰, than the Binuangeun mangrove ecosystem, in Banten. Mangrove vegetation itself has a salinity tolerance level of 10‰ to 30‰ [22]. This shows that the Pulau Dua Nature Reserve has exceeded the salinity tolerance limit for mangrove vegetation, thus threatening its survival due to the high salinity levels present.
3.5 Correlation Analysis Results
The correlation value of the proportion of plastic waste cover with physical chemical parameters can be seen in Table 2. The table is a section of the proportion of plastic waste cover column from the resulting Pearson Correlation Matrix.
According to Table 2, the parameter that have moderate correlation, as the highest value from Pearson Correlation Matrix result in this research, to the proportion of plastic waste cover are bulk density (0.39666) and soil porosity (-0.39666). Bulk density and porosity are closely related. The higher bulk density will fewer gaps between soil particles, which is referred to as porosity. Therefore, the two data points to a negative perfect correlation. The positive moderate correlation between the proportion of plastic waste cover and bulk density can be caused by the high human activity above the ground surface in the area [23]. Another thing that can support the relationship between the proportion of plastic waste cover and bulk density is the change in soil structure that is disturbed due to the presence of plastic waste cover [2].
3.6 Differential Test Analysis Results
The parameter used to divide the class with the plastic waste cover proportion data based on Pearson Correlation Matrix results is the bulk density parameter. The plastic waste cover proportion parameter divides it into four classes. Based on this classes, the bulk density at the same point is calculated for the variance and average in the class group. The results can be seen in Table 3.
Independent Sample T-test was conducted between two classes of bulk density data that have been divided in Table 3. Data in each class will adjust the data distribution specified in the bulk density parameter class. The difference in the amount of data in each class will affect the degree of freedom, resulting in different t-table values. The t-table value is taken using a 95% confidence level and the data distribution is assumed to be even. The calculated t and t-table values obtained can be seen in Table 4.
The six tests conducted showed a similar tendency of results, which were not significantly different between the two groups of data tested. Only two of the six tests had significantly different results. The tests with significantly different results were tests between the two classes of plastic waste cover proportion that were the furthest apart, namely
Table 2.PearsonCorrelation Matrix Section on the Proportion ofWasteCoverColumn
| Characteristics | Correlation Value with the Proportion of Plastic Waste Cover | ||
|---|---|---|---|
| Light Intensity | -0.25202 | ||
| Wind Speed | -0.14485 | ||
| Air Temperature | -0.31132 | ||
| Air Humidity | 0.27687 | ||
| Soil pH | -0.00118 | ||
| Soil Moisture | 0.08499 | ||
| Bulk Density | 0.39666 | ||
| Soil Water Content | -0.17179 | ||
| Soil Porosity | -0.39666 | ||
| Class | Range Class Proportion of Plastic | Data Variance | Average Data of |
|---|---|---|---|
| 1 | Waste Cover (%) 0 | of Bulk Density 0.03476 | Bulk Density 0.48358 |
| 2 | > 0 - 1 | 0.04932 | 0.64231 |
| 3 | > 1 – 2.5 | 0.04656 | 0.47623 |
| 4 | > 2.5 | 0.03309 | 0.79291 |
Table 3.BulkDensity Data DistributionBased on PlasticWasteCoverProportionClass
Table 4.BulkDensity IndependentSampleT-test ResultsBased onPlasticWasteCoverProportionClass
| Class | T Value Based on Calculation | T Value from Table [10] | Conclusion |
|---|---|---|---|
| 1 and 2 | 1.44403 | 2.131 | Not significantly different |
| 1 and 3 | 0.08169 | 2.110 | Not significantly different |
| 1 and 4 | 3.33749 | 2.101 | Significantly different |
| 2 and 3 | 1.48828 | 2.176 | Not significantly different |
| 2 and 4 | 1.32357 | 2.160 | Not significantly different |
| 3 and 4 | 3.34550 | 2.131 | Significantly different |
class 1 (the lowest class) with class 4 (the highest class), and the two classes at the very end, namely class 3 with class 4. The significantly different data results between classes 1 and 4 indicate that the plastic waste cover proportion in class 4 is already different in significantly influencing bulk density. Meanwhile, the significantly different results between class 3 and class 4 can be caused by the upper classes having more diverse values compared to the lower classes. Meanwhile, four of the six tests that did not significantly different results indicated that the bulk density data, divided by proportion of plastic waste cover class, ranging from 0% to 2.5%, did not significantly different. Significant differences bulk density will observed when the proportion plastic waste cover exceeds 2.5% in an area.
4. Conclusion
The physical and chemical characteristics in the Pulau Dua Nature Reserve show that some of its parameters do not match the mangrove vegetation there, such as air temperature and water salinity. This incompatibility can pose a threat to the mangrove vegetation in the Pulau Dua Nature Reserve. Meanwhile, the physical and chemical parameters that are most related to the proportion of plastic waste cover are bulk density and soil porosity. The bulk density value will also significantly different when the proportion of plastic waste cover exceeds 2.5% covering the land, so attention needs to be paid to regulating plastic waste in the Pulau Dua Nature Reserve.
Acknowledgements
We would like to thank the ranks of the Balai Besar Konservasi Sumber Daya Alam (BBKSDA) Jawa Barat who have assisted in the administrative process, as well as the ranks of the Pulau Dua Nature Reserve Resort Management who have provided much assistance in collecting data in the field.
Data Availability
The supplementary data, including the raw data can be accessed via the following link: https://docs.google.com/spreadsheets/d/1 TgIXZUYSTnR1r5oMn6KhMQaEBEYZ873cvdGdwnugHq0/ edit?usp=sharing