
1. Introduction
Ageratum conyzoides or locally known as Bandotan or Wedusan is a type of agricultural weed belonging to the Asteraceae family [1]. This annual herb originates from tropical America, especially Brazil, but has long been introduced and wild in the archipelago. In Indonesia, this species has various local names according to its locality. In West Java, it is called as Babandotan or Babadotan; in most of Java Island, it is called as Wedusan; in Madura Island, it is called as Dus-Bedusan; and Rumput Balam in Pontianak, West Kalimantan Island. While in english name, A. conyzoides is known as Billygoat weed, Goat weed [2, 3], Chick weed, or White weed. This species plant acquires its name because the smell odor it emits resembles the smell odor of a goat.
This plant is widespread throughout tropical regions, even to the subtropics. Imported to Java before 1860, now this weed has spread widely in Indonesia. In South America, this plant is even cultivated. This plant is often found as a nuisance plant in dry rice fields, fields, yards, roadsides, embankments, water edges, and bushy areas. This plant is found up to an altitude of 3,000 m, this herb flowers all year round and can produce up to 40,000 seeds per individual plant. In West Java, this species is widely use as medicinal plants for particular wound remedy [4].
Recently, large scale patterns of species distribution including plants and medicinal plants were impacted by climate change and greenhouse gas concentration determines. Intergovernmental Panel on Climate Change (IPCC) has created several climate scenarios based on greenhouse gas concentrations known as Representative Concentration Pathways (RCP). RCP 8.5 is an emission scenario without policies to reduce emissions with a rapid increase in methane, high use of fossil fuels, and the slow development of technology to reduce the impact of climate change. Then, RCP 8.5 climate scenario is considered suitable to simulate the impacts of climate change on the species' distribution [5]. Recent research has indicated the role of model species distribution. As a result, several methods have been developed to model species distribution at spatial scale. One approach that has been used widely to model the potential spatial distributions of a species is known as machine learning based species distribution modeling (SDM). This model has been used widely to estimate potential distributions of animal [6], ticks [7], vegetation [8], and crops. Among SDMs, there are a growing variety of methods for estimating habitat suitability, including MaxEnt (Maximum Entropy), Bioclim, Domain, generalized additive model (GAM), GLM, and Biomapper. Each machine learning tool is unique, with its own set of pros and downsides. According to Marcer et al. [9], SDM is one of the best and is most often used habitat suitability modeling tools. Several advantages of SDM include the need for only species presence data, the capacity to run with a limited quantity of data, the high accuracy of prediction results, the high reproducibility, and the ability to predict the most discriminating environmental factors [10].
West Java is on of regions known to have high diversity of plants including A. conyzoides and those regions including Bandung and its surrounding areas. Around Bandung, A. conyzoides in its natural habitats has been reported in the Purwakarta, in north of Bandung. While Azka et al. [11] have reported the presences of A. conyzoides in the Cileunyi, west of Bandung. Despite numerous studies are reporting the presences of A. conyzoides in Bandung, while there is still a lack of information on how this species can adapt to the climate change in long terms. Then the novelty of this study is using machine learning to model future distributions of A. conyzoides under climate change scenarios CMIP 5 RCP 8.5 until 2070 in Bandung areas. The results in the forms of potential future distributions of A. conyzoides then can inform the future conservation strategy required for this species.
2. Methodology
2.1. Study Area
The study area is in terrestrial ecosystems of Bandung and its surrounding areas (Figure 1). Those areas including Bandung, Kota Bandung, and Cimahi. In the North, it was bordered by Subang and Purwakarta. In the South, it was bordered by Cianjur and Garut. While, Sumedang was located in the East. Bandung and it surrounding areas were located in the highland with elevation ranging from 675 m above sea level to 1,050 m above sea level. Due to its highland landscape, the climate in Bandung and its surrounding areas is cold weather with average temperature of 23.5 oC and receiving average precipitation rates of 200.4 mm and 21.3 days with rain every month.
2.2. A. conyzoides Surveys
Survey activities were performed for 2 months in 2023 in 9 sampling sites as can be seen in Figure 1. The sampling sites were selected based on the presences of natural
habitats that were considered suitable for A. conyzoides. The presence of A. conyzoides was recorded using direct visual observation or also known as visual encounter survey (VES) and a database provided and gathered from literature reviews sourced from journal articles and reports provided by government agencies, including the agency for agriculture and forestry at the Indonesian Ministry of Environment and Forestry. VES was implemented purposefully by visiting natural habitats including forests and plantations where A. conyzoides may grow. The geographical coordinates of A. conyzoides presences in the field were recorded using the Garmin Etrex 30 type Global Positioning System (GPS). The data were converted to Microsoft Excel and saved in CSV format for use in SDM habitat suitability modelling. The species identification guideline to determine A. conyzoides was based on identification keys [12, 13, 14].
2.3. A. conyzoides Environmental Variables
This study followed Dong et al. [15] and Arshad et al. [16] by included a variety of environmental variables (Table 1). In recent years, habitat suitability modeling has made considerable use of bio-climatic variables (Bio 1–Bio 19) from the worldwide climate database WordClim (www.worldclim. org, the new version 2.0) [17], particularly in the Asian region [18, 19]. The dataset variables represent the climatic variables affecting species, including temperature and precipitation. The climatic variables include warm and cold and dry and cold seasons.
In order to produce an accurate and instructive habitat suitability model, those environmental variables were selected based on the selection and exploitation of environmental aspects that had a major influence. Each environmental variable's contribution to the final model was assessed using Jackknife analysis. A few environmental variables that came from the Jackknife analysis were not included in the model since theymadeno impactwhatsoever(percentage contribution = 0). According to reference [20], the environmental variables had a low average contribution (<6%) or low permutation relevance (<6%). Two crucial elements for comprehending and quantifying the environmental variable's contribution and significance to the SDM model are the contribution percentage and permutation.
2.4. Multicollinearity Test
By utilizing Pearson's correlation tests [21] on 19 environmental variables (Bio 1 – Bio 19) (Table 1), a multicollinearity test was carried out to create a model that performs better with fewer variables and to prevent collinearity between the variable. Highly cross-correlated variables (r2 > 0.8) were eliminated, while variables with r 2 < 0.8 were retained for additional examination in the context of geographical distribution modeling. When multicollinearity arises, a variable's predictive capacity is unstable and
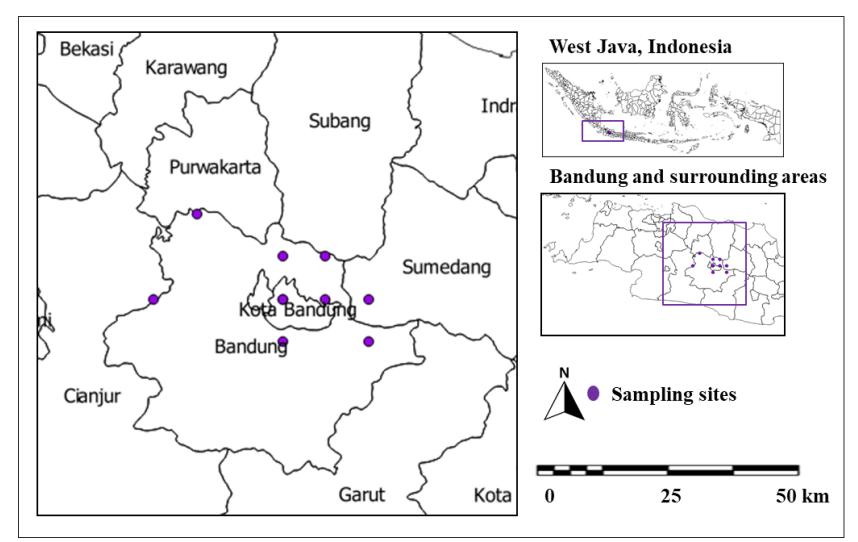
Figure 1. Sampling sites in Bandung and its surrounding areas.
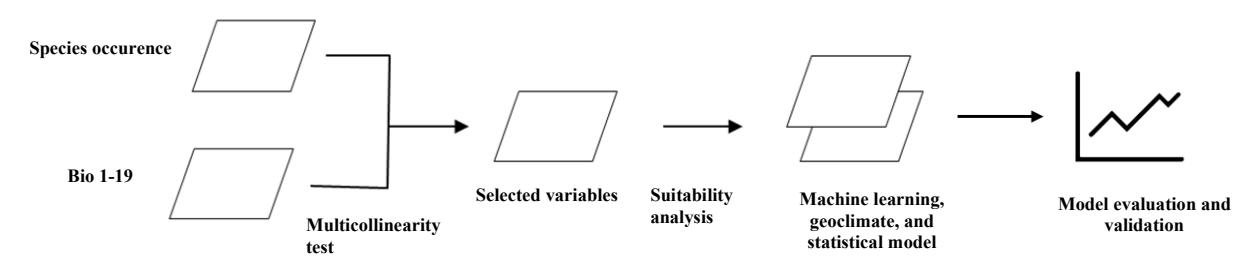
Figure 2. Schematic flowchart showing the SDM pipeline.
inaccurate due to its significant correlation with other variables in the model [22]. The chosen environmental variables to be employed were Bio 1, 3, 5, 11, 12, 13, 14, 15, 16, 17, and 19 based on the results of the multicollinearity test.
2.5. A. conyzoides Suitability Analysis
This study generated predicted suitability maps of A. conyzoides in Bandung and its surrounding areas using machine learning SDM tools in particular MaxEnt algorithm within R platform version 3.6.3 [23]. The particular MaxEnt algorithm is as follows: Pr(y=1|z) = f1(z) Pr(y=1)/f(z),
Let the Pr(y=1|z) is the probability of presence of the A. conyzoides, conditioned on study areas;
Pr(y=1) is the prevalence of the A. conyzoides (proportion of occupied areas) in the study areas;
f(z) is the probability density of environmental variables across study areas;
f1(z) is the probability density of environmental variables within study areas where the A. conyzoides is present.
The pre-processing steps for preparing species suitability analysis include data cleaning, data reduction, data transformation, and data integration. The data cleaning and data reduction to avoid and remove duplication of A. conyzoides occurrence. The data transformation and integration to transform and integrate the A. conyzoides
occurrence with environmental variables. The SDM pipeline started with performing the multicollinearity test to retrieve the bioclimatic variables with less potential of autocorrelation. The next stage is the habitat suitability modeling using several models. The obtained model was then evaluated (Figure 2). Within the SDM pipeline, the feature engineering steps include selecting, transforming, and manipulating A. conyzoides occurrence data to create features and training A. conyzoides occurrence data that are suitable for training machine learning models. A number of R application including sp, dismo [24], library("maptools"), rgdal [25], and raster [26], are needed to create the suitability maps. SDM received 19 environmental variables as inputs (Bio 1 - Bio 19). The performance model was assessed using the receiving operating curve (AUC) area as threshold-independent and correlation coefficient, sensitivity, specificity, The True Skill Statistic (TSS) and Kappa as threshold dependents, and the contribution and influence of each environmental variable on the A. conyzoides habitat suitability model were ascertained using a Jackknife test [27]. AUC values range from 0 (least suitability) to 1, with a value less than 0.5 suggesting that the resulting model is no better than random and uninformative data and a value more than 0.5 showing that the resulting model is highly good and informative.
The prediction map resulting from SDM models was
Table 1.Sampling sitesinBandung and itssurrounding areas.
| Variables | Sources | Format | Unit |
|---|---|---|---|
| Annual mean temperature (Bio 1)* | www.worldclim.org | Image data in Raster | 0C |
| Mean diurnal range (Bio 2) (mean of monthly (max temp - min temp)) | www.worldclim.org | Image data in Raster | 0C |
| Isothermality (Bio 3)* | www.worldclim.org | Image data in Raster | % |
| Temperature seasonality (Bio 4) * | www.worldclim.org | Image data in Raster | 0C |
| Max temperature of warmest month (Bio 5) | www.worldclim.org | Image data in Raster | 0C |
| Min temperature of coldest month (Bio 6) | www.worldclim.org | Image data in Raster | 0C |
| Temperature annual range (Bio 7) | www.worldclim.org | Image data in Raster | 0C |
| Mean temperature of wettest quarter (Bio 8) | www.worldclim.org | Image data in Raster | 0C |
| Mean temperature of driest quarter (Bio 9) | www.worldclim.org | Image data in Raster | 0C |
| Mean temperature of warmest quarter (Bio 10) | www.worldclim.org | Image data in Raster | 0C |
| Mean temperature of coldest quarter (Bio 11)* | www.worldclim.org | Image data in Raster | 0C |
| Annual precipitation (Bio 12)* | www.worldclim.org | Image data in Raster | mm |
| Precipitation of wettest month (Bio 13)* | www.worldclim.org | Image data in Raster | mm |
| Precipitation of driest month (Bio 14) * | www.worldclim.org | Image data in Raster | mm |
| Precipitation seasonality (Bio 15) * | www.worldclim.org | Image data in Raster | dimensionless |
| Precipitation of wettest quarter (Bio 16)* | www.worldclim.org | Image data in Raster | mm |
| Precipitation of driest quarter (Bio 17)* | www.worldclim.org | Image data in Raster | mm |
| Precipitation of warmest quarter (Bio 18) | www.worldclim.org | Image data in Raster | mm |
| Precipitation of coldest quarter (Bio 19)* | www.worldclim.org | Image data in Raster | mm |
*:selectedvariablesbasedonmulticollinearitytestincludingBio1,3,4,11,12,13,14,15,16,18, and 19.
imported into GIS for presentation and additional study [28]. According to Wei et al. [20], habitat suitability levels on the SDM model map can be classified into five suitability level included 0: unsuitable,1: low suitability, 2: medium suitability, 3: high suitability, 4: very high suitability.
2.6. CMIP 5 Future Scenario
Three situations were used in this investigation. The first scenario is the situation as it is in 2023; the second is a future scenario based on the RCP 2.6 and RCP 8.5 estimates from the 5th Coupled Model Intercomparison Project (CMIP) for 2050; and the third scenario is for 2070. The future scenario is based on the Fifth Assessment Report (AR5) [29] of the Intergovernmental Panel on Climate Change (IPCC) using downscaled global climate model data from CMIP5. The IPCC's 2014 AR5 adopted multiple Representative Concentration Pathways (RCPs) for the CMIP 5, which depict trajectories of greenhouse gas concentrations rather than emissions. The forecasts from the Special Report on Emissions Scenarios (SRES) issued in 2000 [30] have been replaced by this. Four potential future climates are described by these routes in climate modeling and study, all of which are thought to be feasible depending on the quantity of greenhouse gases released in the near future. The four RCPs—RPP2.6, RCP4.5, RCP6, and RCP8.5—are called after potential ranges of Radiative Forcing values in the year 2100 in comparison to pre-industrial values (+ 2.6, + 4.5, + 6.0, and + 8.5 W/ m2, respectively), according to [31]. In order to simulate the habitat suitability distributions of A. conyzoides by the years 2050 and 2070, this study chose the RCP 2.6 and RCP8.5 models representing optimistic and pessimistic scenarios.
3. Result and Discussion
This study assessed the habitat suitability of A. conyzoides in Bandung and its surrounding areas in present time and in future time by year 2050 and 2070 under RCP 2.6 and RCP 8.5 climate scenario. The detailed results were explained as follows.
3.1. A. conyzoides Current Occurrence
Figure 1 shows current occurrences of A. conyzoides across in Bandung and its surrounding areas. This species was observed common in north parts of Bandung mainly in areas bordered with Purwakarta and Subang. An occurrence was also recorded in East near Sumedang and in West near Cianjur. While 44% of occurrences were in Bandung and 33% of occurrences were in north parts. A. conyzoides was rare and has limited occurrences in the southernparts. This finding is in agreement with a research reporting the presences of A. conyzoides in the northern parts in Purwakarta areas [4]. While Putri et al. [32] have report A. conyzoides in Sumedang are sizing 1,250 km2 , mostly located in Bandung (56%), Kota Bandung (24%), and Sumedang (16%). The suitable habitats were divided into unsuitable, low suitability, medium suitability, high suitability, and very high suitability areas. West of Bandung, these areas were dominated by areas classified as unsuitable and having low suitability. This is also similar to the eastern parts of Bandung in Sumedang. While areas considered highly suitable and very suitable
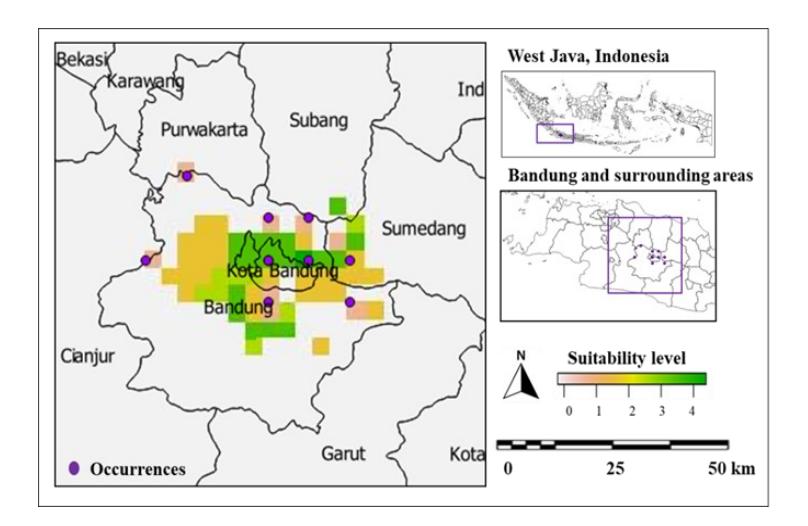
Figure 3.A. conyzoides current distributionmodel(Suitability level 0:unsuitable,1:lowsuitability, 2:mediumsuitability, 3: high suitability, 4: very high suitability).
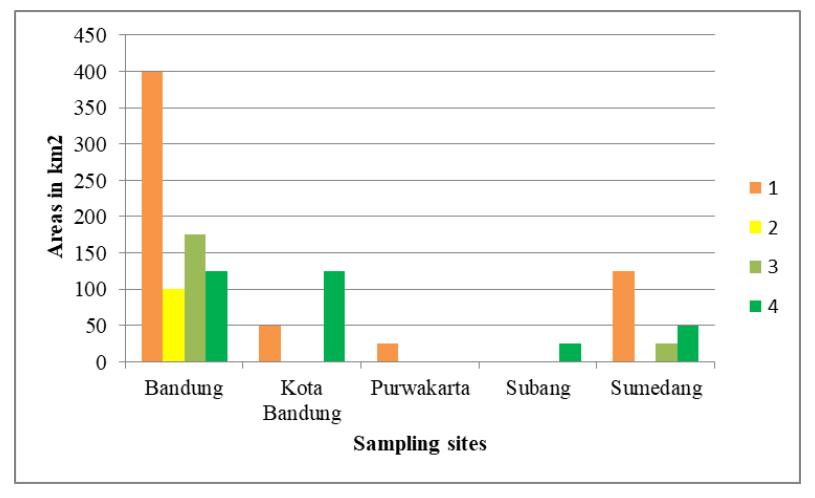
Figure 4.Areas(km2 ) ofA. conyzoides currentdistributionmodel(Suitability level 1:lowsuitability, 2:mediumsuitability, 3:high suitability, 4: very high suitability).
areas and its use asremedy for wound. The community in here used leaf parts and apply as application.
3.2. A. conyzoides Current Distribution Model
Figure 3 shows the current estimated distribution and potential suitable habitats for A. conyzoides across Bandung and its surrounding areas. As can be seen in Figure 4, the current SDM model shows suitable habitats for A. conyzoides were actually located in the two parts, the first parts were concentrated in the northern parts of Kota Bandung, where these areas were dominated by very high suitable areas. The second parts were concentrated in the Bandung, where these areas were dominated by very suitable areas. South of Subang and West of Sumedang, which were bordered by Bandung, were also considered suitable for A. conyzoides at the current time. Based on the AUC analysis (Figure 5), the AUC value
AUC= 0.964
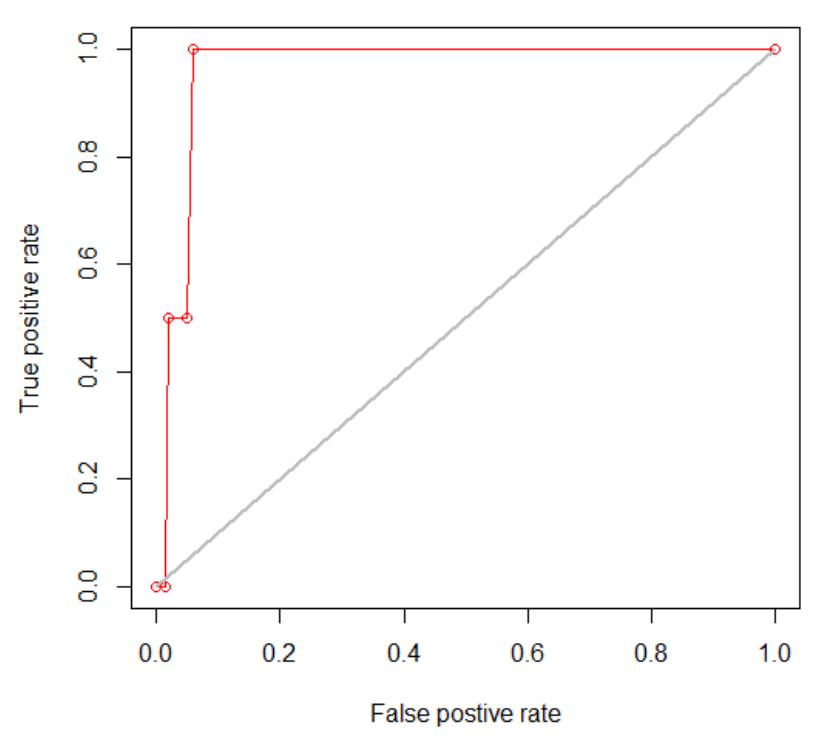
Figure 5. The Receiver Operating Characteristic (ROC) curve result of the model.
of this model is 0.964 (Table 2) and considered this model is highly good and informative.
3.3. A. conyzoides Bioclimatic Variables
Figure 5 shows the response curves of A. conyzoides towards several selected bioclimatic variables. Among those variables, and as can be seen in Table 3, Bio 18 followed by Bio 12 and Bio 11 were bioclimatic variables that contributed more to the distributions of A. conyzoides than other bioclimatic variables. According to the permutation importance analysis, Bio 11, followed by Bio 3, and Bio 18, has significant effects on the model. Bio 18 is the precipitation of the warmest quarter, and this means that an area is considered suitable habitat for A. conyzoides if, during the warm season, it is receiving rainfall with a range of 70–75 mm, as informed by the response curves in Figure 6. While A. conyzoides will prefer mostly habitats with temperature ranging from 22 to 23 °C during the cold season, as can be seen in the Bio 11 response curve. In the tropical regions and in Indonesia, the precipitation of the warmest quarter is considered as a significant variable affecting plant distribution as reported by Gunawan et al. [33] and other study at global scale [34].
3.4. A. conyzoides Future Distribution Model
Climate change is predicted to impact the future distribution model of A. conyzoides. The RCP 2.6, known as the optimistic scenario, as predicted, will yield larger areas suitable for A. conyzoides than the pessimistic scenario under RCP 8.5 (Figure 7). RCP 2.6 yields areas similar to the current distributions. While under the pessimistic scenario in RCP 8.5, suitable areas in Bandung are less than in RCP 2.6 scenarios. In 2070, only suitable habitats in the northern parts remained for both scenarios (Table 4) as can be observed in Subang. According to the model, in the future, A. conyzoides will shift northward to the mountainous areas nearby Tangkuban Perahu Mountain and Bukanegara Hills. Those hilly areas are characterized by low temperatures and rainfall. Those areas characterized by low temperatures will provide a refuge for
Table 2. The evaluation variables.
| Evaluation variables | Threshold- independent | Threshold dependent | ||||
|---|---|---|---|---|---|---|
| Area under the receiver operator (AUC) curve | Correlation coefficient | Sensitivity | Specificity | The True Skill Statistic (TSS) | Kappa | |
| Values | 0.964 | 0.522 | 0.694 | 0.680 | 0.374 | 0.370 |
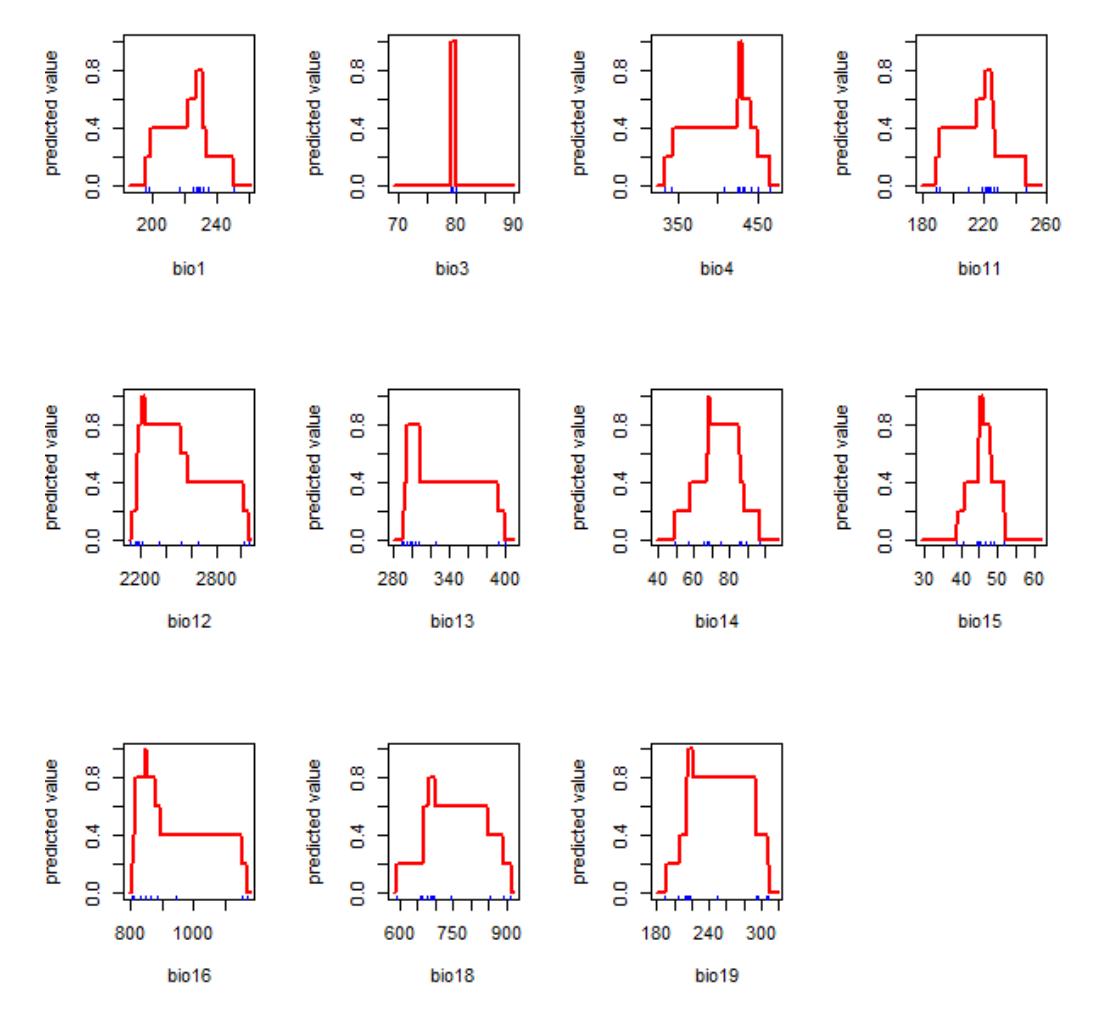
Figure 6.TheReceiver Operating Characteristic (ROC) curve result of the model.
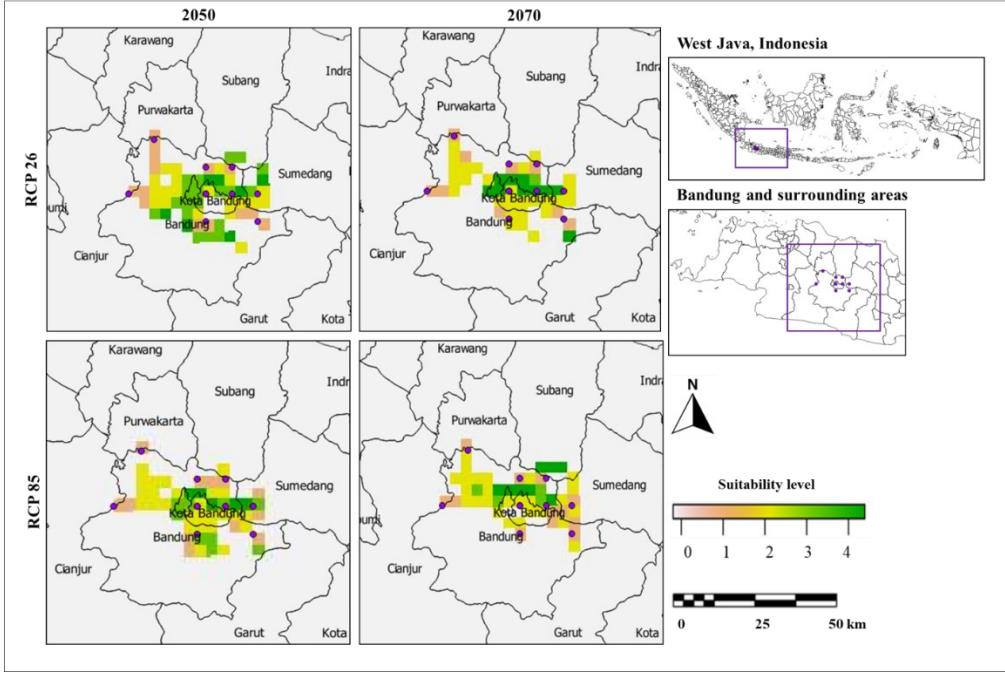
Figure7. A. conyzoidesfuturedistributionmodelforRCP2.6and8.5climate scenarioforyearpf2050and2070(Suitability level0: unsuitable, 1: lowsuitability, 2:mediumsuitability, 3: high suitability, 4: very high suitability).
| Bioclim | Variable | Permutation | |||
| contribution | importance | ||||
| 1 | 10% | 9% | |||
| 3 | 9% | 15% | |||
| 4 | 8% | 10% | |||
| 11 | 11% | 16% | |||
| 12 | 12% | 8% | |||
| 13 | 6% | 11% | |||
| 14 | 1% | 10% | |||
| 15 | 7% | 10% | |||
| 16 | 7% | 11% | |||
| 18 | 17% | 12% | |||
| 19 | 8% | 11% | |||
Table 3.Bioclimvariables and their percent contribution and percent permutation importance reported bymodel
Table 4.Estimated loss or gain areasin km² between the current period and future projections(2050 and 2070) under eachRCPscenario for habitat have a very high suitability.
| Sampling sites | Current | 2050 | 2070 | ||
|---|---|---|---|---|---|
| RCP 2.6 | RCP 8.5 | RCP 2.6 | RCP 8.5 | ||
| Bandung | 125 | -75 | -125 | -100 | -125 |
| Kota Bandung | 125 | -25 | -50 | -50 | -75 |
| Purwakarta | 0 | 0 | 0 | 0 | 0 |
| Subang | 25 | +25 | 0 | 0 | +50 |
| Sumedang | 50 | 0 | -25 | -50 | -50 |
species sensitive to temperature rises due to climate change. In agreement with this, those areas are preferable for A. conyzoides since its growth is best suited to temperatures ranging from 20–25 °C [35]. This explains the shifting of A. conyzoides to the North of Bandung in the future and the disappearance of suitable habitats in the South. The shifting of suitable habitat to the north then encourages some areas in the northern region to need to be protected, including Tangkuban Perahu Mountain and Bukanegara Hills.
3.5. Limitations of the study
There are certain limits to this study's methodology. The VES is used in this study to record the species' presences that could compromise the model's correctness. Potential drawbacks of VESs include biases associated with habitat features, observer experience, and species detectability, especially for low-density or cryptic species. Besides that, the duration of this study, which was quite short, only 2 months, also limited the number of samples that were required for the model.
4. Conclusion
The current SDM model shows suitable habitats for A. conyzoides are sizing 1,250 km2 , mostly located in Bandung
(56%), Kota Bandung (24%), and Sumedang (16%). Based on the model, at the current time, there are two locations that are suitable for A. conyzoides. The first locations were in the northern parts of Kota Bandung, where these areas were dominated by very suitable areas. The second location was concentrated in Bandung, where these areas were dominated by very suitable areas. A. conyzoides prefers habitats with rainfall with range of 70-75 mm during warm season and temperature ranging from 22 to 23 °C during the cold season. Climate change is predicted to impact the future distribution model of A. conyzoides. In 2070, only suitable habitats in the northern parts of Bandung remained for both scenarios. The result is considered very useful in contributing to the particular local government's zoning policy and climate-resilient agriculture strategies. It provides empirical evidence about suitable areas for A. conyzoides. It is strongly recommended to prioritize northwards of Bandung, covering Subang and including the Tangkuban Perahu Mountain and Bukanegara Hills regions.
Acknowledgements
We are deeply indebted to the many stakeholders including students that have contributed to the survey and collection of data.
358 DOI: 10.5614/3bio.2025.7.2.3