
1. Introduction
Phenolic compounds and flavonoids are secondary metabolites produced by plants and have been widely studied in food biochemistry due to their important roles. These two compounds not only functioned as part of the plant's defense system against various environmental stresses, such as pest and disease attacks, but also contributed to the chemical properties and functional value of plant-based foods. Many studies have shown that flavonoids exhibit strong antioxidant activity, particularly by neutralizing free radicals, potentially providing benefits for human health [1]. In tropical fruits, studies on phenolic and flavonoid content were highly relevant
because high concentrations of these compounds were often associated with beneficial antioxidant activity. Several types of flavonoids, such as quercetin and epicatechin, have been reported to have strong antioxidant capabilities and play an important role in determining the functional quality of fruit [2]. Therefore, a deeper understanding of the phenolic and flavonoid compounds in tropical fruits not only enriches the scientific basis for the health benefits of plant-based foods but also opens opportunities to develop functional food products that support healthier consumption patterns among the population [3,4].
Crystal guava (Psidium guajava Linn.) was one of the tropical fruits known to have a diversity of secondary
metabolites, especially phenolics and flavonoids. However, the composition of these compounds was not always uniform because it was influenced by various factors, including genetic differences, varieties or cultivars, growing conditions, and the part of the plant being analyzed. Research shows that variations in the content of bioactive compounds in guava can occur between varieties and between parts of the plant, so that the results obtained from one variety or a specific part cannot be directly generalized to other varieties [5,6]. This condition underscores the need for more targeted research to examine the phenolic and flavonoid profiles of each guava variety.
One of the most widely consumed guava cultivars was crystal guava (P. guajava Linn. cv. Kristal). This cultivar was known for its thick flesh, crisp texture, and relatively low seed content, which made it highly sought after by consumers [7]. Despite its high popularity, scientific studies specifically examining the profiles of phenolic compounds and flavonoids in crystal guava fruit remain relatively limited. In fact, previous studies have shown that the phenolic compound content in guava seeds can vary between varieties, so that research results from other varieties cannot directly represent crystal guava [8]. These data limitations indicated the need for more specific research to supplement scientific information on the chemical quality, nutritional value, and bioactivity potential of crystal guava as a superior fruit for consumption [7,9].
In addition to varietal differences, the content of phenolic compounds and flavonoids in fruit was also influenced by the sample preparation and extraction methods used. The use of dried samples is often preferred for the analysis of bioactive compounds because it can reduce variation caused by differences in moisture content, thereby improving the consistency and comparability of results. Several studies have shown that different drying techniques can affect extraction results, with certain methods, such as freeze drying, reported to maintain and even increase phenolic compound levels compared to other methods [10]. Furthermore, investigations on various extraction techniques revealed that methodological differences not only influenced the concentration of bioactive compounds obtained but also affected the stability and characteristics of the resulting extracts [11]. Therefore, selecting appropriate preparation and extraction methods was crucial to ensure data accuracy and reproducibility of research results.
The UV–Vis spectrophotometric approach using the Folin–Ciocalteu and AlCl3 methods has been widely employed to determine the total phenolic and flavonoid content in plant materials. This method was considered relatively simple and sensitive and capable of generating quantitative data suitable for statistical analysis, leading to its widespread adoption in bioactive compound research [12]. Through this approach, the total phenolic and total flavonoid contents of a material can be systematically and quantitatively described, enabling further understanding of their contributions to antioxidant activity and the potential health benefits of food ingredients [13]. Several studies have also demonstrated that the Folin–Ciocalteu method is effective foronfirming the correlation between phenolic content and antioxidant activity in plant extracts [14]. In addition to providing a qualitative overview, this UV–Vis-based analysis produces quantitative data relevant to nutritional and health assessments, thereby supporting the validity of research results in the field of functional foods [15,16].
Based on this background, this study aims to determine the total phenolic and total flavonoids in crystal guava (P. guajava Linn. cv. Kristal) fruit extract using UV–Vis spectrophotometry. The results of this study were expected to provide a clearer scientific picture of the bioactive compound content in crystal guava and to serve as a basis for further studies in biochemistry and food research based on biological resources.
2. Methodology
This study was conducted in December 2023. Samples of crystal guava (P. guajava Linn. cv Kristal) were obtained from a crystal guava orchard located in Sabah Balau, Tanjung Bintang District, South Lampung Regency, Indonesia. All stages of laboratory analysis were carried out at the Agricultural Product Technology Laboratory, Lampung State Polytechnic. This study was a laboratory-based, experimental-analytical study. Quantitative analysis was performed using UV–Vis spectrophotometry. Guava fruit flesh (mesocarp) samples were obtained through purposive sampling. Sample selection was based on physiological maturity, which was determined through visual and sensory characteristics, including bright green to evenly white-green fruit skin color, fruit weight of 200–250 g, large fruit size, distinctive guava aroma, sweet taste, and crisp fruit flesh texture. These three samples were taken from different trees planted in the same location.
2. 1 Sample Preparation
The preparation of guava samples began with washing them under running water to remove any dirt, followed by peeling and separating the skin, seeds, and flesh. The fruit flesh was then thinly sliced to speed up the drying process. The drying stage was carried out in two stages: drying in the sun for ±3 days, followed by drying in an oven at 40 °C until a constant weight was achieved. The dried samples were subsequently ground using a blender into a fine powder and sieved to obtain a relatively uniform particle size. The drying and particle size adjustment processes were important stages in sample preparation because they affected the stability and availability of bioactive compounds, particularly phenolic and flavonoid compounds, which were associated with the antioxidant activity and functional properties of guava [1,7,17].
2.2. Extraction
Extraction of bioactive compounds from guava was carried out using the maceration method, a commonly used and proven-effective method for extracting various bioactive compounds, especially phenolic compounds and flavonoids. A total of 250 g of simplisia powder was macerated with 750 mL of p.a. methanol in a closed container protected from light for 72 hours. Methanol was selected as the solvent because its polarity was suitable for optimally dissolving phenolic compounds [18,19]. After the maceration was complete, the mixture was filtered using filter paper or a Buchner funnel, and the filtrate was evaporated in a rotary evaporator at 40 °C until a thick extract was obtained. The resulting extract contains bioactive compounds, including flavonoids and other phenolic compounds, which play an important role in the antioxidant activity of guava. Several studies have also reported that the content and antioxidant potential of phenolic compounds in guava can vary depending on the extraction method used [20–23].
2.3. Determination of Total Flavonoids
Total flavonoid content was determined using the AlCl3 complexation method with quercetin as a standard. A quercetin standard solution was prepared at concentrations of 10–50 ppm. The extract was dissolved in p.a. methanol to a certain concentration, then reacted with methanol, 10% AlCl3 solution, and 1 M potassium acetate. The mixture was incubated for 30 minutes at room temperature. Absorbance was measured at 431 nm using a UV–Vis spectrophotometer, an effective wavelength for detecting the formation of flavonoid–AlCl3complexes [24]. The analysis was performed in triplicate, and the results were expressed as mg quercetin equivalent per gram of extract (mg QE/g) and mg gallic acid equivalent per gram of extract (mg GAE/g).
2.4. Determination of Total Phenolics
The determination of total phenolic content was performed using the Folin–Ciocalteu method with gallic acid as the standard. Gallic acid standard solutions were prepared at concentrations of 0.5–25 ppm. The extract solution was reacted with the Folin–Ciocalteu reagent, then 7% Na2 CO3 solution was added and incubated for 2 hours at room temperature. Absorbance measurements were performed using a UV-Vis spectrophotometer at a wavelength of 760 nm [25,26]. The analysis was performed in triplicate, and the results were expressed as mg of gallic acid equivalent per gram of extract (mg GAE/g), which allowed for accurate comparisons between samples [25,27].
2.5. Data Analysis
The measurement results were presented as mean values ± standard deviation. Since the normality and homogeneity tests indicated non-normality, a nonparametric Kruskal– Wallis test was used to analyze differences between groups, as it was more robust to violations of normality assumptions [28]. Furthermore, when significant differences were identified, the analysis was continued using the Mann– Whitney test at a significance level of 5% (p<0.05). All statistical analyses were performed using SPSS software.
3. Results and discussion
Sample preparation and extraction of crystal guava fruit pulp were essential initial steps for obtaining high-quality extracts that are ready for further analysis. This stage was crucial because the quality of the extract was largely determined by the selection of raw materials, the initial sample treatment, and the extraction method employed [29]. Crystal guava fruits were selected based on differences in color and size as indicators of ripeness, which were important in ensuring optimal extraction of bioactive compounds [30]. The fruits were categorized into different ripeness levels based on observable morphological characteristics, particularly variations in skin color and flesh texture. Changes in skin color from green to yellow or yellow-green were commonly recognized as visual indicators of ripeness in guavas [31]. These indicators were widely used in horticultural assessment as practical markers of ripening. Classification was conducted consistently across all samples to ensure uniform treatment and to evaluate potential differences in bioactive compound content during fruit maturation. After washing and separation of fruit parts, the samples were dried to reduce moisture content and to prevent chemical changes that could affect the stability of bioactive compounds. This drying stage was reported to play an important role in maintaining the stability of dried materials and influencing the content of phenolic compounds and flavonoids, with fruit ripeness and solvent polarity being considered determining factors in extraction efficiency [29,30].
The dried material was then ground into a powder to increase the surface area of contact with the solvent during the extraction process. Extraction was carried out using methanol as the solvent, which was known to yield a concentrated extract with a specific yield. This yield value was used as an initial indicator of extraction efficiency and provides a quantitative description of the proportion of dissolved components extracted from guava fruit pulp [32]. The extracted material was then analyzed to determine the content of phenolic compounds and total flavonoids, as well as to evaluate its bioactive potential, including antioxidant activity and other chemical components beneficial to health [33,34]. The yield
calculation results are shown in Table 1.
Table 1 showed that the extraction of crystal guava pulp using 90% methanol resulted in a yield of 8.08%. This value indicated that the proportion of compounds extracted, which were likely polar in nature and soluble in methanol, was relatively low. The 90% methanol solvent was recognized as an effective polar solvent for extracting bioactive compounds, particularly those with polar to semi-polar characteristics [21,35]. The percentage yield reflected the total amount of compounds successfully extracted from the plant material. The yield was influenced by the type of solvent and its polarity, as each solvent possessed a different capacity to dissolve specific chemical components. The next analysis was the measurement of the quercetin standard solution.
Based on Figure 1, the quercetin standard curve showed an excellent linear relationship between concentration and absorbance with the regression equation y = 0.004x + 0.0509 and a coefficient of determination (R² = 0.9917). This value indicated that the method employed had a high degree of linearity and was suitable for determining the total flavonoid content in extract samples. The quercetin standard curve was used as a basis for determining the total flavonoid content in crystal guava fruit extract samples.
The relationship between quercetin concentration and absorbance values measured with a UV–Vis spectrophotometer was necessary to obtain a regression equation, which was subsequently used to calculate total flavonoid content as quercetin equivalents. Flavonoid content was determined using spectrophotometry. Determining flavonoid content by spectrophotometry allows for effective identification of variations in nutritional content and provides insight into the chemical properties of natural materials. This study was in line with previous research showing that UV-Vis spectrophotometry on extracts has been proven effective for determining total flavonoid content with high precision [36,37]. Figure 2 presents a comparison of total flavonoid content in crystal guava fruit extract from three different maturity levels, indicated by differences in fruit skin color. This presentation aims to illustrate variation in total flavonoid content and to identify significant differences between samples using nonparametric statistical analysis.
The highest total flavonoid content was found in sample 3 (greenish-white crystal guava flesh), followed by sample 1 (bright green), while the lowest content was found in sample
| Methanol | Weight of | Weight of | Yield | Organoleptic |
|---|---|---|---|---|
| Extract | Simplisia (g) | Extract (g) | (%) | |
| 90% | 250 g | 20.2 g | 8.08% | The extract was not too thick, dark brown in color, slightly sticky, and has a pungent odor. |
Table 1. Yield of methanol extract from crystal guava fruit pulp
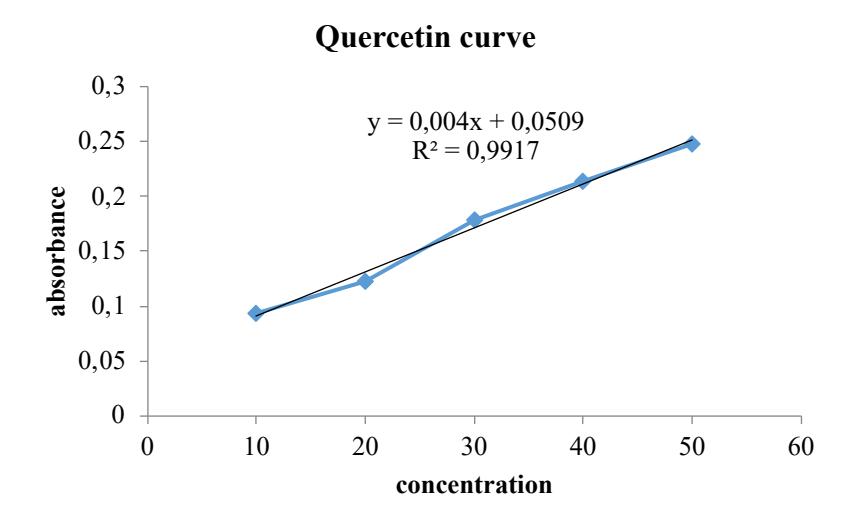
Figure 1. Graph of absorbance measurements of quercetin standard solutions
2 (whitish-green) at 130.9 mg QE/g extract, 93.3 mg QE/g extract, and 185.9 mg QE/g extract, respectively (Fig. 2). The differences in letters for each sample indicate statistically significant differences (p<0.05), suggesting that fruit ripeness affects the total flavonoid content in crystal guava fruit flesh. Previous studies have shown that flavonoid and phenolic compound content can vary with fruit ripeness, demonstrating that biological processes during ripening phase affect nutritional quality and antioxidant activity [38,39].
The standard curve of gallic acid (Fig. 3) illustrates the relationship between gallic acid concentration and absorbance values measured using a UV–Vis spectrophotometer, which subsequently served as the basis for calculating total phenolic content as gallic acid equivalents. The use of a UV-Vis spectrophotometer to determine absorbance values as a basis for calculating total phenolic content was supported by the literature, which showed that this method is the standard for phenolic content determination [40,41]. The relationship between gallic acid concentration and absorbance value guides the determination of the phenolic concentration in fruit extracts, thereby ensuring the accuracy of test results [40,42].
The standard curve of gallic acid shows a strong linear relationship between concentration and absorbance with the regression equation y = 0.0135x + 0.1871 and a coefficient
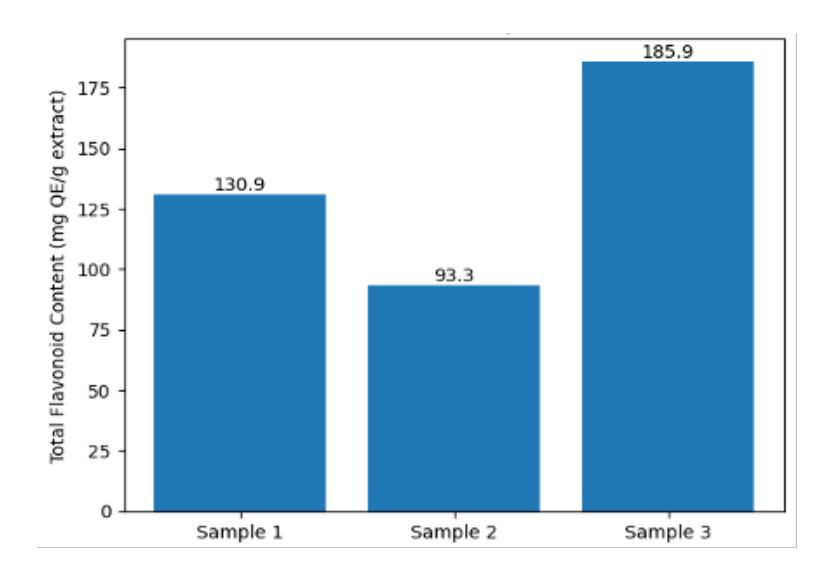
Figure 2. The total flavonoid content in crystal guava fruit extract. Sample 1: bright green crystal guava fruit flesh; Sample 2: whitish-green crystal guava fruit flesh; Sample 3: evenly white-green crystal guava fruit flesh.
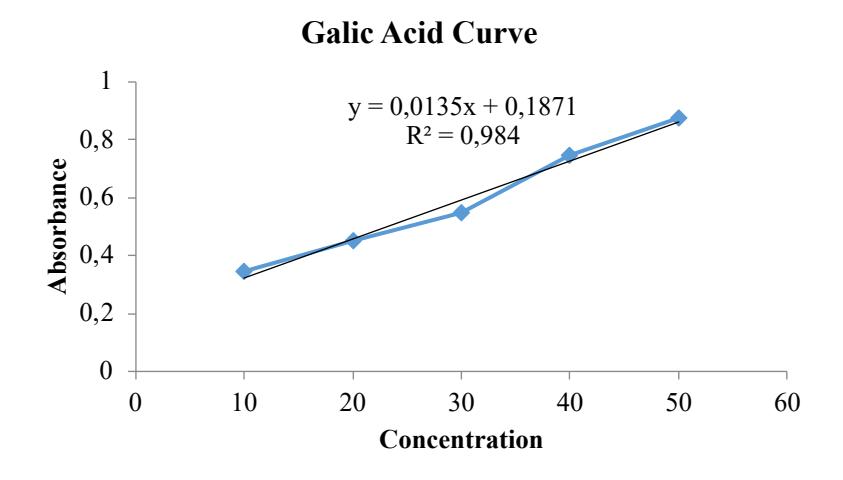
Figure 3. Graph of the absorbance results of the standard curve of gallic acid.
of determination (R² = 0.984, Fig. 3). These values indicate that the method used has good linearity and is suitable for determining the total phenolic content in crystal guava fruit extract samples. Further analysis was carried out by calculating the total phenolic content. Figure 4 presents a comparison of total phenolic content in crystal guava fruit extract from three different maturity levels, marked by variations in fruit skin color. This data presentation aims to show the pattern of changes in total phenolic content and to identify differences between samples based on statistical analysis.
The highest total phenolic content was found in sample 3 (greenish-white crystal guava flesh), followed by sample 2 (greenish-white) and sample 1 (bright green, Fig. 4). The differences in values and different letter markings indicate statistically significant differences (p<0.05), suggesting that fruit ripeness affects the total phenolic content in crystal guava fruit flesh. Previous studies have shown that the pharmacokinetics of bioactive compounds, including flavonoids, differ at each ripeness level, which can be explained through a spectrophotometric approach to measure flavonoids and phenolic compounds [38,43].
Table 2 and Table 3 present the results of nonparametric statistical analyses evaluating differences in total flavonoid and phenolic content in crystal guava fruit extracts at three maturity levels. The Kruskal–Wallis test was used to identify overall differences between groups, and the Mann–Whitney test was used as a follow-up analysis to determine differences between sample pairs. These nonparametric statistical tests were chosen because the data were not normally distributed,
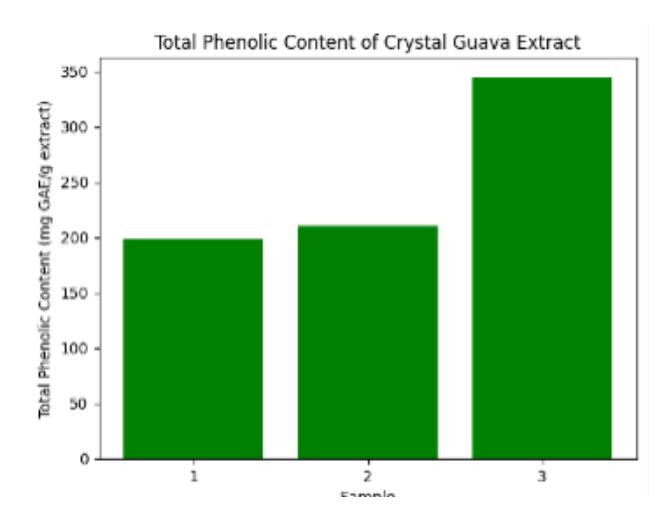
Figure 4. The total phenolic content in the crystal guava fruit flesh. Sample 1: crystal guava fruit flesh with bright green color; Sample 2: crystal guava fruit flesh with whitish green color; Sample 3: crystal guava fruit flesh with uniform white-green color
as is often the case in the analysis of bioactive compounds such as flavonoids and phenolics, which are influenced by genetic factors and environmental conditions during fruit growth [44,45].
Based on the Kruskal–Wallis test results, the flavonoid and total phenolic content showed significant differences between samples (p=0.025). The Mann–Whitney test further showed that each sample had significantly different values, with the highest levels of flavonoids and total phenolics found in sample 3, followed by samples 1 and 2, confirming that differences in fruit ripeness affect the content of bioactive compounds in crystal guava fruit flesh. Flavonoids often show the highest concentration in unripe fruit and can decrease as the fruit ripens [46,47]. These findings confirm that fruit ripeness significantly affects the bioactive compound content in crystal guava fruit flesh, similar to previous studies indicating that the phenolic and flavonoid content in various types of fruit decreases with ripeness [48,49].
Table 2. Kruskal-Wallis test of flavonoid and total phenolic content in crystal guava fruit flesh
| Results | Flavonoids | Phenolics |
|---|---|---|
| Chi-Square | 7.385 | 7.385 |
| df | 2 | 2 |
| Asymp. Sig. | 0.025 | 0.025 |
| Description | Significantly different | Significantly different |
Table 3. Whitney test for total flavonoid content in crystal guava fruit pulp
| Content | Sample | Mean±SD |
|---|---|---|
| Flavonoids | 1 | 13±0.0006b |
| 2 | 9±0.002a | |
| 3 | 19±0.0006c | |
| Phenolics | 1 | 20±0.0006a |
| 2 | 21±0.0006b | |
| 3 | 34±0.0006c |
Description. Sample 1: bright green crystal guava flesh; sample 2: whitish green crystal guava flesh; sample 3: evenly white green crystal guava flesh. The same letters indicate no significant difference between groups based on the Mann-Whitney test.
4. Conclusion
The results showed that the highest total flavonoid content was found in sample 3 (greenish-white crystal guava flesh), followed by sample 1 (bright green). In contrast, the lowest content was found in sample 2 (greenish-white). The highest total phenolic content was found in sample 3, followed by sample 2 and sample 1 at 198.5 mg GAE/g extract, 210.4 mg GAE/g extract, and 345.0 mg GAE/g extract, respectively. Statistical analysis showed significant differences (p<0.05) in total phenolic and flavonoid content between extract groups. These findings indicate that crystal guava fruit extract has significant variation in phenolic and flavonoid compound content, making it a potential subject for further study in the context of food-based bioactive compound utilization.
Acknowledgements
We are deeply indebted to the many stakeholders, including students and the community of the sampled locations, whom have contributed to the survey and collection of data.