
Introduction
The water utility company owned by DKI Jakarta province, PAM Jaya, can only serve 64% of the population (2023), with 36% of the population relying on alternative water sources such as 1 Research Center for Environmental and Clean Technologies, National Research and Innovation Agency, Indonesia. (*Corresponding author). Email: nicco.plamonia@brin.go.id
2 Oceanography Research Center, National Research and Innovation Agency, Indonesia
3 Research Center for Limnology and Water Resources, National Research and Innovation Agency, Indonesia
4 Geological Disaster Research Center, National Research and Innovation Agency, Indonesia
5 National Research and Innovation Agency, Indonesia
7 Research Center for Mining Technology, National Research and Innovation Agency, Indonesia
9 Civil Engineering, Faculty of Engineering, Universitas Pancasila, Jakarta, Indonesia
groundwater, raw water (surface water) (Jayanti et al., 2025), bottled water, and water from itinerant vendors (Plamonia, 2020). This highlights the challenges of drinking water distribution and the need for sustainable drinking water management solutions in meeting the growing demand for water in Jakarta. The issue is multifaceted, with one of the most significant challenges being the high non-revenue water (henceforth, NRW) rate, which reaches 45.62% (298,164,838 m³). This substantial loss of water, due to factors such as leakage, illegal connections, and inaccurate metering, severely impacts the efficiency and sustainability of the water distribution system. Reducing NRW is crucial for improving service coverage and ensuring a more reliable water supply to the population of Jakarta. PAM Jaya has a relatively large production capacity (653,580,000 m³ per year), but it incurs revenue from only 356,962,228 m³ of water per year. This significant problem has persisted for over 35 years, both during management by municipalities and when managed by private or multinational companies through concessions (such as Suez and Thames Water) (Nugroho, 2020). In short, the performance has not improved and the system has failed to address the underlying issues of inefficiency and water loss. These interlinked constraints—losses of 45.62% and sub-optimal pressure of approximately 4 m head—constitute the primary drivers motivating the adoption of UWSTs as a reliability buffer. The primary impact of the high leakage rate is the uneven and low water pressure, particularly in areas far from production facilities such as Cilincing (North Jakarta—Badan Pusat Statistik Provinsi DKI Jakarta, 2021; Taftazani et al., 2022) and Kramat Jati (East Jakarta—Badan Pusat Statistik Provinsi DKI Jakarta, 2021, 2023; Plamonia, 2020; Plamonia, Anjani, et al., 2024). This, in turn, affects the water consumption patterns in both households and office buildings.
As Indonesia's capital and the nation's administrative and economic hub, the metropole of Jakarta exhibits a distinct 'daytime–nighttime population' dynamic. During the day, the city's population rises to approximately 14.46 million, driven by commuters traveling from surrounding regions for work and business activities. This influx places additional stress on urban infrastructure, particularly the water supply network. At night, the population decreases to about 10.56 million, reflecting the return of commuters to suburban areas (Badan Pusat Statistik Provinsi DKI Jakarta, 2021, 2023). There are approximately 3.7 million commuters entering Jakarta from the surrounding areas (Jakarta, Bogor, Tangerang, and Bekasi, collectively known as JABODETABEK) (Badan Pusat Statistik Provinsi DKI Jakarta, 2021, 2023). The study sites are located within Jakarta's major employment zones, where daily commuter inflows significantly increase daytime water demand. The influx of commuter workers, followed by a significant spike in water demand during working hours, greatly impacts water pressure and the stability of the distribution system (Plamonia & Pribadi, 2024; Setiadi & Pratiwiningrum, 2020)
The low performance of utilities at the micro level asks for a response from business owners, as they cannot operate without a reliable water supply. At the decision-making level, disruption of the water supply directly influences local, regional, and national economic activities, making it a critical issue that requires immediate attention. The challenges faced by water utilities, especially in terms of fluctuating supply and pressure, have broader implications for both business operations and economic stability. To mitigate these issues, particularly in highdemand areas, innovative solutions like UWST are becoming increasingly important. By providing a localized water storage system, businesses can reduce their reliance on inconsistent public water distribution, ensuring more reliable and stable water access during peak hours.
At the micro scale, such as in single-story buildings, UWSTs offer an efficient and practical solution to address water supply challenges. Hence, we propose the implementation of UWSTs as a reliable water storage system (Gauthier et al., 2000). UWSTs allow water to be stored under
normal pressure and used during times of high-water demand (Artiola et al., 2012; Sanjuan-Delmás et al., 2015). Its purpose is to reduce dependence on distribution over a certain period and ensure a more stable water supply. The use of UWSTs has been implemented in various countries, for example in Kashan City, Iran, where storage tanks are used to maintain the stability of the water supply (Jamshidzadeh & Mirbagheri, 2011). In Sant Adrià del Besòs, Spain, this technology is used to enhance water supply management and distribution efficiency (Jurado et al., 2017).
We believe that implementing UWSTs in Jakarta could be one of the key actions to ensure continuous water availability (Slavik et al., 2020) and reduce low water pressure (Sekhar et al., 2023). This study does not address secondary impacts, including the increased electricity cost for pumping water vertically from the UWST to upper floors, nor other quality and operational challenges. Designing an UWST involves considering factors such as daily water consumption, tank capacity design, and the availability of space within the building. This approach can help optimize water management, enhance supply stability, and support the city's efforts to address water scarcity and infrastructure challenges. This study sought to answer two main questions: (1) to what extent can UWST improve the stability of the water supply in multi-story buildings under intermittent pressure conditions; (2) how can the tank capacity and hydraulic design be optimized within the space constraints in buildings to ensure reliable daily water availability. The research aimed to provide a practical framework for enhancing water supply reliability in commercial and residential buildings amid Jakarta's unstable distribution network.
Methods
This section is divided into two parts: part one discusses the study location, covering the specific regions in Jakarta studied, including factors like population distribution, water consumption patterns, and infrastructure conditions; part two discusses the conceptual model and data analysis, outlining the theoretical framework and methods used to analyze the data, including models and simulations to assess the effectiveness of UWSTs in improving water supply and distribution.
Study Location
Based on data from the Building Supervision and Enforcement Office of DKI Jakarta Province in 2023 (Indonesian: Dinas Pengawasan dan Penertiban Bangunan Provinsi DKI Jakarta in 2023), buildings in Jakarta can be categorized into three groups:
- (1) high-rise buildings (≥13 floors), totaling 149 units with an average of 40 floors per building (totaling 5,960 floors);
- (2) mid-rise buildings (5 to 12 floors), totaling 2,300 units with an average of 8 floors per building (totaling 18,400 floors);
- (3) low-rise buildings (3 to 4 floors), totaling 3,700 units with an average of 5 floors per building (totaling 18,500 floors).
Overall, the total number of floors across the three building categories is 42,860 floors, spread over 6,149 buildings. Therefore, this calculation results in an average of approximately 7 floors per building (42,860 ÷ 6,149 ≈ 7). Therefore, for analytical consistency, this study assumed all buildings to have seven floors. Simplifying the floor count to 7 floors per building aimed to: (1) simplify the calculations and standardize the water consumption modeling for UWST capacity estimation; (2) streamline the calculation model and improve consistency in estimating daily and annual water consumption per building, which was used to determine UWST capacity; and (3) address the heterogeneity of building typologies, where variations in the number of floors
between different buildings make it challenging to model water consumption individually. This approach of using an average helps to group buildings into a single standard representation that is more practical and easier to process.
This rest of this section is divided into three subsections: (1) Field Observations, (2) Interviews and Water Consumption Surveys, and (3) Documentation Study.
Field Observations
The water supply in Jakarta is managed by PAM Jaya and distributed through a metropolitan pipeline network that serves different pressure zones across the five administrative municipalities. Figure 1 shows an administrative map of Jakarta and the locations of the buildings in this study.
Field observations (Ciesielska et al., 2017) were conducted across three 7-story buildings over a 5-day period (May 6 to 10, 2024) to gather empirical data on water consumption patterns. These buildings in North, Central, and South Jakarta were strategically selected to represent various areas of the city, providing a comprehensive overview of water usage across different neighborhoods. The three study sites represent different parts of the urban distribution network within Jakarta: Graha KAS Building in South Jakarta, Menteng Kebon Sirih Building in Central Jakarta, and Yos Sudarso Building in North Jakarta. They reflect spatial variation in water pressure conditions and distribution network performance across the city. This diverse selection of building locations helped to capture variations in water consumption related to geographical factors, building types, and proximity to water supply infrastructure. The detailed observations aimed to better understand how water consumption fluctuates across different times of day and under varying demand conditions, which is critical for assessing the potential impact of UWST solutions (See Figures 1 and 2).
Continuous pressure measurements were recorded at each site using automatic data loggers (Solinst Levelogger Edge; accuracy ±0.05 m head) installed on the main inlet line. Logging was conducted over five consecutive days (6 to 10 May 2024) with a 10-minute recording interval to capture short-term fluctuations and verify supply stability. The resulting time-series confirmed mean inlet pressures of 4.0 ± 0.2 m head (≈0.4 atm) across all sites. These temporal profiles are presented in Figure 10.
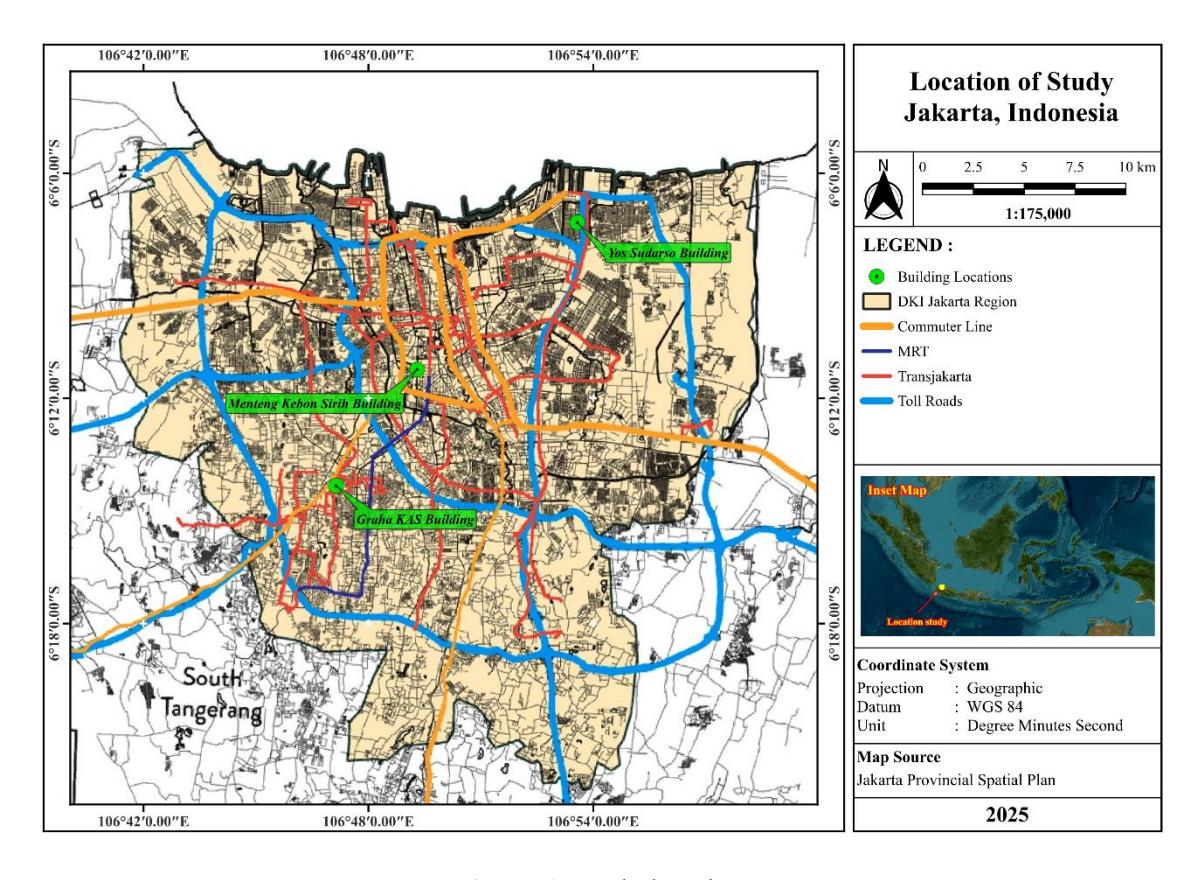
Figure 1. Study location.
Graha KAS Building, South Jakarta. Latitude: 6°14'19.67"S, Longitude: 106°47'8.01"E
Menteng Kebon Sirih Building, Central Jakarta. Latitude: 6°11'13.78"S, Longitude: 106°49'17.92"E.
Yos Sudarso Building, North Jakarta. Latitude: 6°7'18.89"S, Longitude: 106°53'34.42"E.
Figure 2. Locations of the buildings in this study.
The three buildings were purposively selected to represent different pressure-service contexts across Jakarta's commercial zones (North, Central, and South Jakarta). According to utility performance reports (Badan Pusat Statistik Provinsi DKI Jakarta, 2021, 2023) and previous spatial assessments of distribution inequality (Taftazani et al., 2022), these districts experience recurrent low-pressure conditions, particularly during peak demand periods. These districts also experience strong daytime population concentration due to commuter inflows, which intensifies water demand during working hours and contributes to pressure variability within the distribution system. Although limited to three cases, the selection captures spatial heterogeneity in service reliability and reflects the dominant mid-rise typology (approximately seven floors) that characterizes Jakarta's commercial building stock. The sampling strategy therefore prioritized representativeness of pressure-service conditions rather than statistical generalization.
This study did not aim to provide statistical generalization across all 6,149 commercial buildings in Jakarta. Instead, it adopted an analytical case-study approach in which buildings were selected to represent dominant service-pressure typologies within the metropolitan distribution network. The three surveyed buildings correspond to the prevailing mid-rise commercial typology (≈7 floors), which constitutes the largest proportion of Jakarta's nonhousehold connections. By focusing on this modal building form and selecting sites across differentiated pressure contexts (North, Central, and South Jakarta), the study aimed to capture the structural characteristics of the system rather than isolated building anomalies. The number of cases was therefore determined by typological representativeness and spatial heterogeneity, not by statistical sampling requirements.
From a spatial planning perspective, the selected buildings are located in districts that have historically experienced uneven service performance within Jakarta's distribution network. North Jakarta is situated farther from major production facilities and has been associated with recurrent pressure drops and groundwater abstraction pressures. Central Jakarta represents the core administrative and commercial district, where daytime demand surges due to commuter concentration create hydraulic stress during peak hours. South Jakarta reflects mixed residential–commercial zones where demand variability intersects with an aging distribution infrastructure. By selecting sites across these differentiated service contexts, the study aimed to capture spatial heterogeneity in pressure reliability and highlights how infrastructure performance varies across metropolitan sub-regions. The cases therefore illustrate not isolated building problems, but manifestations of broader spatial inequality in Jakarta's urban water distribution system.
Interviews and Water Consumption Surveys
Interviews were conducted with three building managers and two representatives from the local water utility (PDAM) to collect information on daily water consumption and other relevant aspects related to the study. Additionally, a survey was distributed among 150 employees working in the buildings at the study locations (Ghanad, 2023). The survey aimed to gather more detailed data on individual water consumption across different conditions and times of day. The data obtained was anticipated to be sufficiently representative in illustrating the water consumption patterns observed in these buildings. The number of 150 office users per building was verified from attendance records and tenant logs from 6 to 10 May 2024 and further confirmed through interviews with building management. This value represents the average occupancy observed across the three surveyed seven-story buildings. The resulting maximum tank capacity of 25.69 m³ was derived from field measurements and geometric constraints in these buildings, designed to balance storage efficiency, underground space limitations, and structural safety. The capacity exceeds the instantaneous peak demand because it also accounts for hydraulic stability under intermittent low-pressure conditions, ensuring reliable supply continuity during on-peak hours.
Documentation Study
Data collection involved reviewing five annual reports from PDAM for the 2019-2024 period, which provided information on the water supply to the multi-story buildings included in the study. Additionally, three infrastructure documents for each sampled building were analyzed to verify the compatibility of the existing water systems with the estimated water consumption needs. The documentation study approach (Jain, 2021) allowed for a comprehensive comparison of the reported water supply data with the infrastructure capabilities of each building, helping to assess whether the current systems were sufficient to meet demand.
Conceptual Model and Data Analysis
This section is divided into two parts: (1) Conceptual Model and (2) Evaluative Criteria and Outcome Indicators.
Conceptual Model
The conceptual model is a descriptive representation, not a statistical model, illustrating the hypothesized causal relationships among the key variables. This study examined the interaction between water consumption patterns (independent variable) and water supply stability (dependent variable), with the storage tank system acting as a mediating variable that intervenes between the two (see Figure 3). The proposed system employs an unpressurized (vented) UWST, designed to temporarily store water under normal distribution pressure. According to our calculations, water is subsequently delivered to the upper floors using a 2.2 kW multi-stage booster pump operating at 2.5 bar (≈25 m head). This configuration effectively isolates the building's internal plumbing from unstable municipal pressure, ensuring reliable supply continuity. However, it is important to note that vertical pumping to upper floors was not the main focus of this study. Under ideal conditions, the municipal water pressure should be sufficiently high to deliver water directly to the upper floors of multi-story buildings without the need for UWSTs. Nevertheless, the field reality in Jakarta shows otherwise—low and fluctuating supply pressure necessitates the implementation of UWSTs as reliability buffers to ensure consistent service.
The proposed storage tank system was designed as an unpressurised (vented) UWST that temporarily stores water under normal distribution pressure. According to our calculations, water is subsequently delivered to the upper floors using a 2.2 kW multi-stage booster pump, operating at a duty pressure of 25 m head). This configuration effectively isolates the building's internal plumbing system from unstable municipal pressure, ensuring a reliable and continuous water supply without direct dependence on the main distribution network.
Figure 3. Conceptual model.
Hourly water-use patterns were obtained directly from survey data and are summarized in Table 3 without intermediate conversion equations.
Underground Water Storage Tank
Surveys in three commercial buildings in Jakarta—Graha KAS, Menteng Kebon Sirih, and Yos Sudarso—revealed consistently low water pressure from PAM Jaya, insufficient to supply upper floors, particularly the 7th floor. To address this, we recommend installing a UWST at each site to store water during off-peak hours and release water during peak demand, ensuring stable water distribution. The storage capacity, measured in liters or cubic meters, acts as a mediating variable, directly influenced by the inlet pressure (Plamonia, Saputra, et al., 2024) from the main utility supply.
Field measurements taken over five consecutive days during the peak dry season (March-May) showed an average inlet pressure of approximately 4 m head. However, PAM Jaya disputed these findings, claiming that annual monitoring over 365 days indicated a pressure range of 5 to 10 m head, with an average of 7.5 m head. Flow into the storage tanks was estimated through Darcy–Weisbach calculations using DN100 PVC pipes (f = 0.026) and verified by spot flow meter readings (ultrasonic ±2%). The 0.4 atm value corresponds to a static head of 4.07 m measured with a digital transducer installed at the building inlet. To reconcile these differences, three simulation scenarios were developed: a low-pressure scenario at 4 m head (based on field data), a medium-pressure scenario at 7.5 m head (based on PAM Jaya's claim), and a highpressure scenario at 15 m head to account for potential pressure surges beyond both the measured and the reported averages.
Water Supply Stability
Water supply stability, as the dependent variable, was measured under two conditions: (+) Stable or (–) Unstable. The evaluation criteria and output indicators in this study included water consumption patterns, storage tank capacity, and supply stability. Together, these factors
provide a comprehensive overview of how each variable influences the overall water distribution system.
Evaluative Criteria and Outcome Indicator
Evaluative criteria were used to judge the performance of the system by examining the patterns of interactions and outcomes (McGinnis, 2011). The evaluation criteria in this study focused on system performance, which can be categorized into two causal relationship models—negative and positive—reflecting the typical patterns of interaction as follows: (1) Positive Interaction Pattern: an adequate storage system improves water supply stability by absorbing peak demand, enhancing overall system performance (Wang et al., 2025); (2) Negative Interaction Pattern: having no or a poorly designed storage system reduces supply stability, as direct reliance on the main supply fails to handle peak demand, increasing the risk of service disruption. Meanwhile, outcome indicators were employed to assess the immediate results or impacts of a program, intervention, or system on the target population, reflecting changes in behavior, condition, or performance that can be attributed to the implemented actions (McGinnis, 2011). The relationship between the evaluation criteria and the outcome indicators reflects the interaction among the independent variable (water consumption pattern), the mediating variable (water storage capacity), and the dependent variable (water supply stability), as detailed in Table 1.
Table 1. Relationship between Evaluation Criteria, Variables, and Outcome Indicators
| Evaluation Criteria | Variable | No. | Outcome Indicator / Output | Unit | |
|---|---|---|---|---|---|
| System Performances | Independent | 1 | Water Usage Patterns | Litre/hour | |
| (Negative) (-) or | Mediating | 2 | UWST | Litre | |
| (Positive) (+) | Dependant | 3 | Water Supply Stability | Stable (+) / Unstable (-) | |
Results and Discussion
This section is divided into two parts: (1) Results and (2) Discussion.
Results
A summary of the key water consumption and distribution metrics for Jakarta based on the field survey data is provided in Table 2 below:
Table 2. Key Water Consumption and Distribution Metrics
| No. | Description | Value | Unit | |||||
| 1 | Total Population of Jakarta plus commuting population | 14,456,000 | People | |||||
| 2 | Total population of Jakarta | 10,760,000 | People | |||||
| 3 | Total commuter population | 3,696,000 | People | |||||
| 4 | Population served by water utility (64%) | 6,864,000 | People | |||||
| 5 | Population not served by water utility (36%) | 3,896,000 | People | |||||
| 6 | Water production capacity reported by water utility | 653,583,600 | m³/year | |||||
| 7 | Water distributed reported by water utility | 653,583,600 | m³/year | |||||
| 8 | NRW | 298,164,838 | m³/year | |||||
| 9 | NRW (%) | 45.62 | % | |||||
| 10 | NRW ratio (NRW / water production) | 0.4562 | ||||||
| 11 | Total household connections | 932,892 | Connections | |||||
| No. | Description | Value | Unit |
|---|---|---|---|
| 12 | Household connections for 6.864 million people | 926,743 | Connections |
| 13 | Average people per household connection | 7.41 | People/connection |
| 14 | Water consumption per person per day | 134.15 | litre/person/day |
| 15 | Water consumption per person per day | 0.134 | m³/person/day |
| 16 | Water consumption per household per day | 0.986 | m³/house/day |
| 17 | Water consumption per household per year | 359.89 | m³/house/year |
| 18 | Total water consumption per day (6.864 million people) | 920,803 | m³/day |
| 19 | Total water consumption per year (6.864 million people) | 336,093,192 | m³/year |
| 20 | Formal worker commuters in 6,149 buildings | 922,350 | People |
| 21 | Total non-household connections (buildings) | 6,149 | Connections |
| 22 | Average people per building connection | 150 | People/connection |
| 23 | Water consumption per building per day | 9,250 | litre/building/day |
| 24 | Water consumption per building per day | 9.25 | m³/day |
| 25 | Total water consumption per day (922,350 people in 6,149 buildings) | 56,878 | m³/day |
| 26 | Total water consumption per year (922,350 people in 6,149 buildings) | 20,760,561 | m³/year |
| 27 | Combined total water consumption per day (households + buildings) | 977,682 | m³/day |
| 28 | Combined total water consumption per year (households + buildings) | 356,853,753 | m³/year |
| 29 | Water sold by PAM Jaya | 356,962,228 | m³/year |
| 30 | Difference (combined consumption – PAM Jaya sales) | 108,475 | m³/year |
| 31 | Absolute error | 0.03 | % |
| 32 | Water pressure at customer homes (by test) | 4.07 | m head (≈ 0.4 atm) |
| 33 | Water pressure at customer homes (according to water utilities) | 7.50 | m head (≈ 0.73 atm) |
| 34 | Water pressure at customer homes (optimistic scenario) | 15.00 | m head (≈ 1.45 atm) |
The water consumption and distribution profile of Jakarta illustrates the demand of a large urban population of approximately 14.46 million people, comprising both permanent residents and daily commuters. Of this total, 64% (6.86 million people) are served by the city's water utility, while the remaining 36% rely on alternative water sources. The annual production capacity of the utility is estimated at 653,580,000 m³ per year, which is slightly lower than the 656.4 million m³ of water distributed. However, the NRW—as the volume of water produced that cannot be billed due to leakage, illegal connections, or metering inaccuracies—remains considerably high at 45.62%, equivalent to approximately 298.2 million m³ per year. The utility currently operates around 932,892 household connections, each serving an average of 7.41 people per connection, with an estimated daily per-capita consumption of 134.15 liters. On an annual basis, the total domestic water demand amounts to approximately 336.1 million m³.
In the commercial sector, 922,350 formal workers are distributed across 6,149 non-household connections (mainly office buildings), each consuming an average of 9.25 m³ per day. This corresponds to an additional 20.76 million m³ of water annually. When combined, the total household and commercial water consumption in Jakarta reaches 977,682 m³ per day or 356.85 million m³ per year, which closely aligns with PAM Jaya's reported annual water sales of 356.96 million m³, showing an absolute error margin of only 0.03%. Field measurements of water pressure indicate a discrepancy between 4.07 m head (≈0.4 atm) from direct testing and 7.5 m head (≈0.73 atm) reported by the water utility, highlighting potential inconsistencies in system performance at the consumer level (H.Z. Rahman et al., 2024). Here, the subsequent results are presented in three sections, namely: (1) water consumption patterns as the independent variable; (2) UWST as the mediating variable; and (3) water supply stability as the dependent variable.
Figure 4 shows the five-day pressure time-traces recorded at the three study sites (Graha KAS, Menteng Kebon Sirih, and Yos Sudarso) from 6 to 10 May 2024. Pressure fluctuations follow the city's daily consumption cycle, remaining highest (≈4.2 m) during off-peak hours (00:01 to 05:00 and 20:01 to 24:00) and lowest (≈3.8 m) during peak demand (08:01 to 16:00). The amplitude of ±0.2 m corresponds to the hourly water-use pattern of office buildings (Table 6), where flow rates increase from 0.09 to 0.81 m³ h⁻¹ per building. These time-series confirm that the daily pressure variability is primarily driven by consumption load rather than network anomalies, validating the assumption underlying the pressure-volume proportionality model.
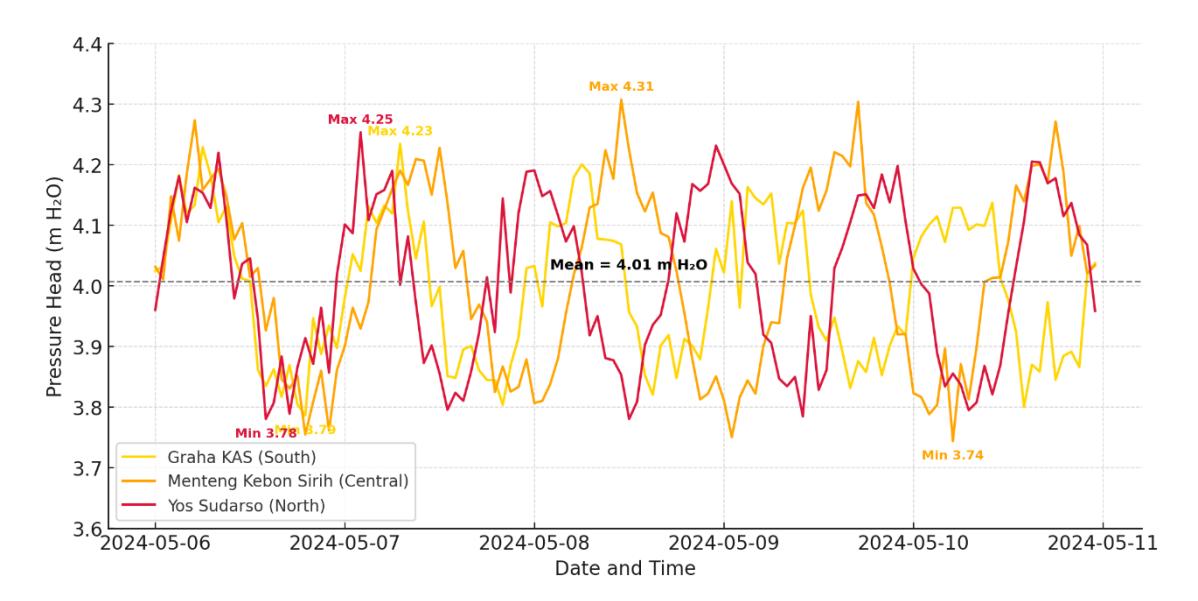
Figure 4. Five-day pressure profiles at study sites (May 2024): hourly head (m) vs time.
Consumption Patterns (Independent Variables)
The water consumption patterns are categorized into four sections: (1) residential water consumption; (2) office building water consumption; (3) consumption surges due to incoming commuters; and (4) off-peak consumption periods.
Daily Hourly Water Consumption Patterns in Residential Units
A total of 64% (6.88 million) of Jakarta's full-time residents have access to piped drinking water through 932,892 household connections. The recorded daily per capita water consumption is 134.15 liters per person per day. In contrast, in developed countries, the average number of people served per household connection typically ranges between 3 and 5, whereas in Jakarta, each connection serves an average of 7.41 people, indicating a higher dependency on single connections. This indicates a greater reliance on shared water connections among Jakarta's residents, potentially reflecting higher residential density or limited household-level infrastructure. The high number of people per connection reflects Jakarta's dense housing conditions (Mulyana et al., 2024a), where multiple families share a single house, rented room, or boarding house due to economic factors, land scarcity (Rahman et al., 2024), and communal
living patterns (M. Natsir et al., 2010). Average water consumption per connection reaches 0.986 m³/day (986 L), as shown in Figure 4, and is further analyzed against respondents' hourly activities to map consumption patterns.
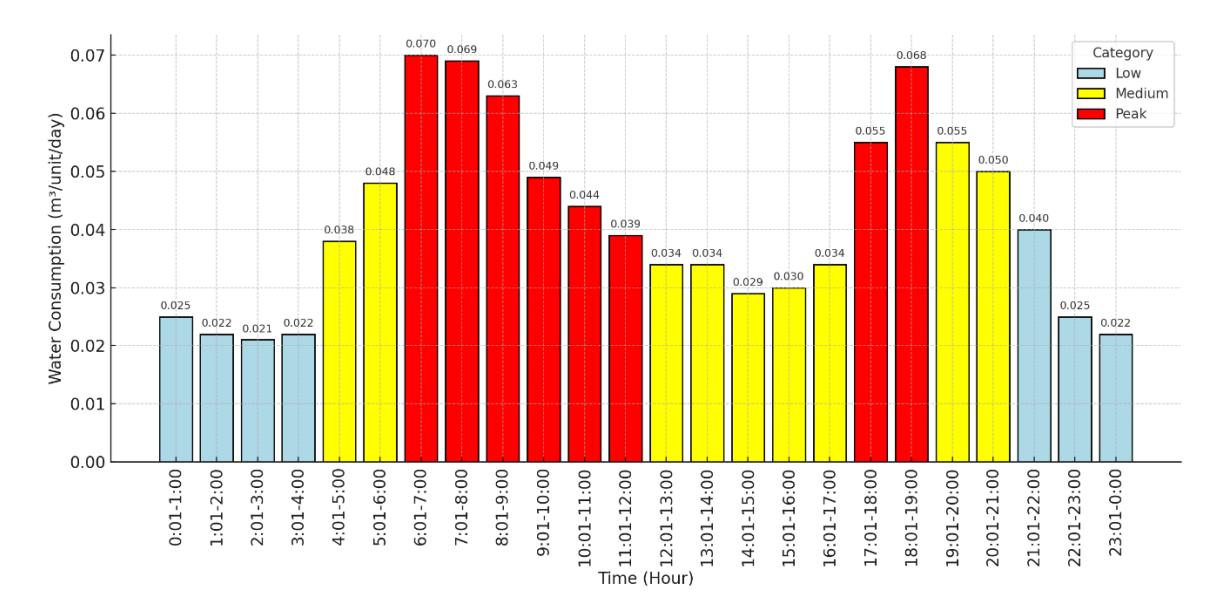
Figure 5. Hourly residential water use (m³/unit/day); categorized as Low, Medium, and Peak.
Figure 5 illustrates six daily water consumption patterns in residential units:
- (1) Night (00:01 to 04:00) – consumption is very low (0.021-0.038 m³/unit/day) because most people are sleeping or performing minimal activities;
- (2) Early morning (04:01 to 06:00) – usage increases sharply from 0.038-0.048 m³/unit/day as residents begin morning routines such as bathing and preparing for the day;
- (3) Morning to midday (06:01 to 12:00) – water use remains stable between 0.039 and 0.0700 m³/unit/day for light activities and lunch preparation;
- (4) Midday to afternoon (12:01 to 17:00) – consumption decreases to 0.029-0.034 m³/unit/day as many people are away at work or school;
- (5) Afternoon to evening (17:01 to 19:00) – demand rises again to 0.055-0.068 m³/unit/day due to bathing, ablution, and dinner activities;
- (6) Evening (19:01 to 00:00) – consumption gradually decreases to 0.022-0.055 m³/unit/day as residents prepare for rest.
The overall 24-hour profile shows two distinct peaks—morning (06:01 to 12:00) and late afternoon (17:01 to 19:00)—and two troughs during midnight (00:01 to 04:00) and late night (19:01 to 00:00). This daily pattern remains consistent on both weekdays and weekends, as the residential population in Jakarta remains relatively stable throughout the week.
Water Consumption Pattern of Office Building Occupants in Jakarta
On weekdays, Jakarta's population increases to 14.46 million due to the arrival of approximately 3.7 million commuters. Among them, 922,350 formal-sector workers occupy office buildings. Consequently, during working hours, a total of approximately 7.79 million people (6.88 million residents + 922,350 office workers) have access to piped water (see Figure 6).
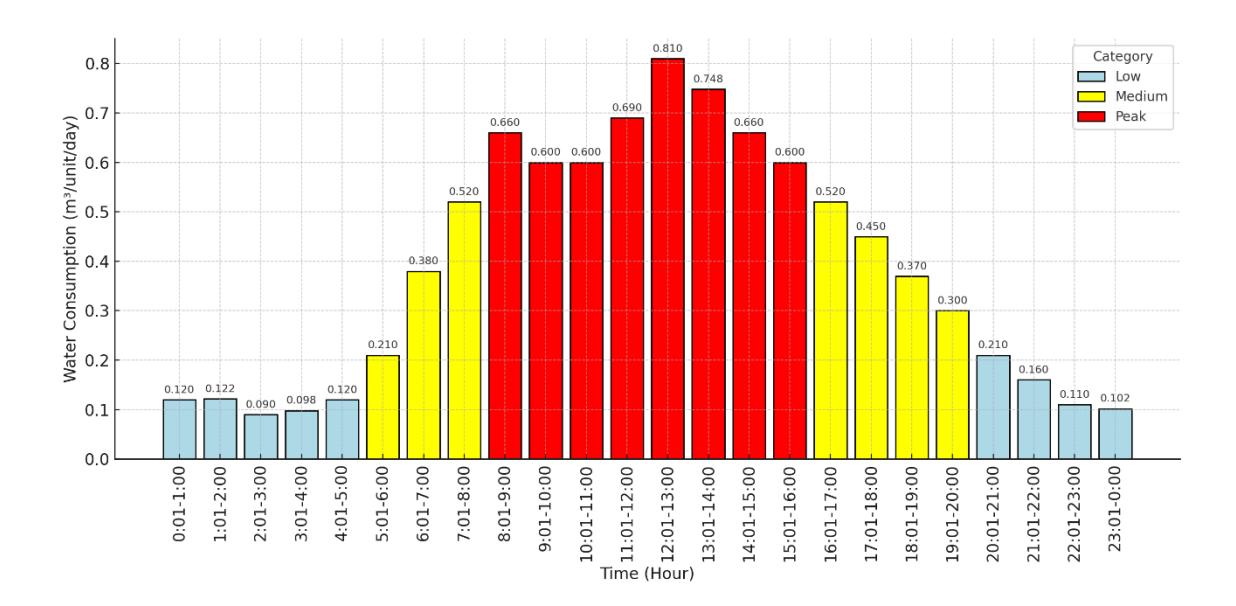
Figure 6. Water consumption patterns in office buildings.
Figure 6 illustrates five distinct hourly water-consumption patterns in office buildings.
- (1) Nighttime (00:01 to 05:00) very low consumption (0.09-0.122 m³/unit/day) due to minimal activity;
- (2) Morning (05:01 to 08:00 – a sharp rise to 0.21-0.52 m³/unit/day as employees arrive and begin their daily routines;
- (3) Daytime (08:01 to 16:00) consistently high usage between 0.60 and 0.81 m³/unit/day, representing peak working hours and intensive facility operation;
- (4) Late afternoon to evening (16:01 to 20:00) gradual decline from 0.52 to 0.30 m³/unit/day as office activities wind down;
- (5) Late evening (20:01 to 24:00) lowest levels (gradual decline from 0.21 to 0.102 m³/unit/day) as most offices close and occupants leave.
The 24-hour profile in Figure 6 clearly shows two medium-consumption periods (05:01 to 08:00 and 16:01 to 20:00) surrounding a single peak (08:01 to 16:00, 0.81 m³/hour). The lowest consumption occurs between 00:01 to 05:00 and again after 20:01. This pattern remains consistent on weekdays, closely following office-hour routines, ablution periods, and lunch breaks typical of Jakarta's formal workplaces.
Combined Daily Water Consumption Patterns in Residential and Office Buildings
Total water consumption amounts to 977,682 m³ per day, or 356.96 million m³ annually, closely matching PAM Jaya's reported sales volume of 356.96 million m³ in 2023. This minor discrepancy (0.03%) likely reflects rounding and reporting differences between aggregated survey data and utility sales statistics, as acknowledged by personnel of the water utility. Residential and office-sector water-consumption patterns can be combined, as both rely on the same source, i.e., the Jakarta water utility.
Figure 7 below presents the verified combined daily consumption pattern of residential and office sectors in Jakarta, ensuring numerical consistency and a total alignment of 977,682 m³/day. The chart distinguishes three series—Residential, Office, and Combined—each representing sectoral contributions to total demand. Residential consumption dominates the early-morning and night-time periods, while office usage drives the peak between 08:01 and 16:00. The combined curve confirms a dual-peak pattern typical of Jakarta's urban activity cycle.
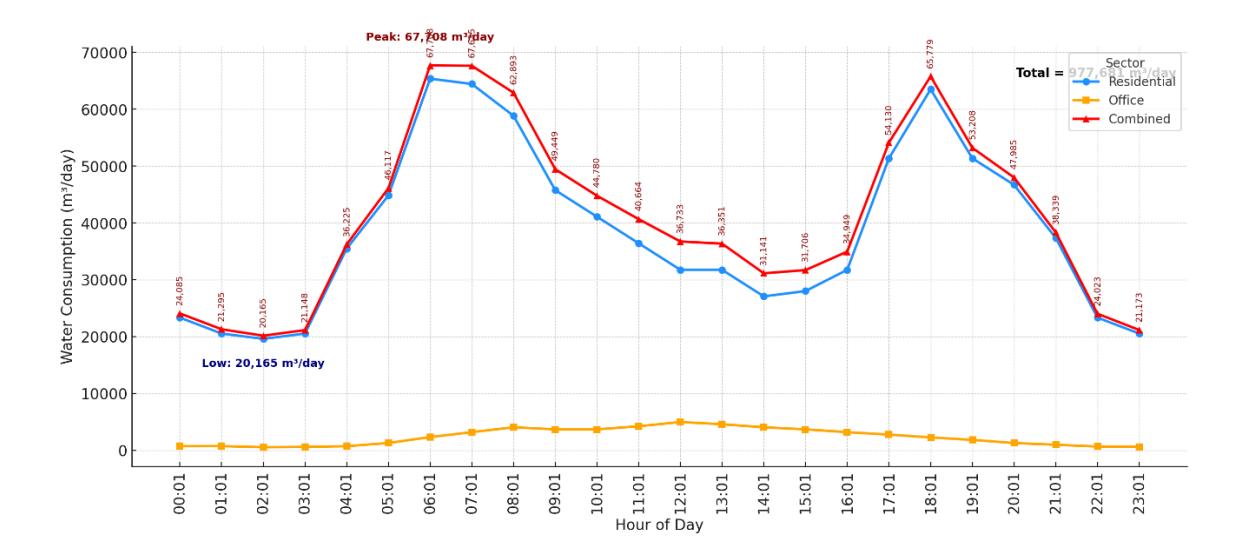
Figure 7. Combined daily consumption of the residential and office sectors.
Hourly residential, office, and combined water-use values are plotted in Figure 7, with numeric annotations on the combined series. Peak (67,708 m³/day), low (20,165 m³/day), and total (977,682 m³/day) values are highlighted. The dual-peak pattern (06:01-12:00 and 17:01-19:00) reflects Jakarta's urban activity cycle and has full numerical consistency with Table 3.
Table 3. Combined Daily Water-Consumption per Period in Residential and Office Buildings (m³/day)
| No. | Time | Water Consumption (m³/day) | Description |
|---|---|---|---|
| 1 | 00:01-05:00 (Off-peak) | 21,148-36,225 | Low consumption, dominated by permanent residents; office buildings inactive |
| 2 | 05:01-08:00 | 46,117-67,708 | Surge in domestic use and start of commuter activities |
| 3 | 08:01-16:00 (Peak) | 31,141-62,893 | Office consumption peaks; residential use remains stable |
| 4 | 16:01-20:00 | 31,706-65,779 | Office activity declines; domestic consumption increases |
| 5 | 20:01-24:00 (Off-peak) | 21,173-47,985 | Evening decline, light activities dominated by residents |
These intervals indicate that water demand peaks during standard office hours (08:01-16:00) and decreases steadily thereafter. Over a 24-hour cycle, the consumption patterns of permanent residents and commuters show clear dual peaks that coincide with office working hours. The daytime surge (08:01-16:00, 31,141-62,893 m³/day) substantially elevates total urban demand, affecting distribution stability. The magnitude of this increase highlights the role of commuter inflow as a decisive factor in Jakarta's daily demand profile.
Table 4. Contribution of Commuters to Daily Water Demand (m³/day)
| Category | People | Liter/person/day | Volume (m³/day) | Share (%) | |||
| Residential Units | 6,864,000 | 134 | 920,803 | 88% | |||
| Office Building Occupants | 922,350 | 62 | 56,878 | 12% | |||
| Total | 7,786,350 | 125 | 977,682 | 100% | |||
Table 4 confirms that commuters contribute approximately 12% of total daily water demand small in proportion yet critical during daytime peaks. Permanent residents account for the majority (88%) with an average use of 134 liters per person per day. Although commuters represent a smaller fraction of the daytime population, their aggregated consumption significantly increases total demand during peak working hours. This transient-population effect must be incorporated into future water-distribution design and management, particularly for Jakarta's central business and commercial districts, to maintain reliability and prevent service disruption during high-demand periods.
Peak and Off-Peak Water-Consumption Patterns in Office Buildings
Water consumption patterns in office buildings exhibit distinct fluctuations throughout the day, closely aligned with the arrival, activity level, and departure of formal-sector workers. These fluctuations are categorized into peak and off-peak periods, providing insight into how daily office operations impact total water demand. Table 5 summarizes the hourly distribution.
Table 5. Hourly Water Volume per Building across Five Operational Periods (m³ per 1-hour interval)
| No. | Time Period | Hourly Water Volume per Building (m³) | Description |
|---|---|---|---|
| 1 | 00:01-05:00 (Off peak) | 0.09-0.122 | Low consumption; offices inactive |
| 2 | 05:01-08:00 | 0.21-0.52 | Consumption surge as commuters begin activities |
| 3 | 08:01-16:00 (Peak) | 0.66-0.81 | Peak office activity and water usage |
| 4 | 16:01-20:00 | 0.52-0.45 | Gradual decrease; office activities winding down |
| 5 | 20:01-24:00 (Off peak) | 0.12-0.102 | Low consumption; offices inactive |
Note: Values represent discrete water volumes (m³) consumed within each one-hour interval, not continuous flow rates (m³/h).
This pattern reflects the typical working schedule of Jakarta's office buildings, where water demand rises sharply during the morning as employees arrive and remains high throughout working hours. After 16:00, water consumption begins to decline as the workforce departs, reaching its lowest levels during late evening and early morning hours when offices are unoccupied.
On-Peak Period
During office hours—especially in the peak period from 08:01 to 16:00—water consumption rises substantially. Table 6 details the eight-hour on-peak consumption for an assumed occupancy of 150 people.
Table 6. Hourly Water Volume During On-Peak Period (08:01-16:00) per Building (m³ per 1-hour interval)
| No. | Time Period | Hourly Water Volume During On-Peak Period (m³ per hour interval) | Category |
|---|---|---|---|
| 1 | 08:01-09:00 | 0.66 | Peak |
| 2 | 09:01-10:00 | 0.60 | Peak |
| 3 | 10:01-11:00 | 0.60 | Peak |
| 4 | 11:01-12:00 | 0.69 | Peak |
| 5 | 12:01-13:00 | 0.81 | Peak |
| 6 | 13:01-14:00 | 0.75 | Peak |
| 7 | 14:01-15:00 | 0.66 | Peak |
| 8 | 15:01-16:00 | 0.60 | Peak |
| Total = 5.368 m³ (150 people) |
• Notes:
During the on-peak period (08:00-16:00), water consumption within the buildings is supplied from two concurrent sources: approximately 65% originates from the stored volume in the UWST and the remaining 35% from real-time inflow through the PAM Jaya network. This dual-source configuration ensures that supply to all floors remains stable despite fluctuating inlet pressure. However, because a portion of the tank's capacity is drawn down during these eight hours, the subsequent refill duration is extended from 9 to approximately 10 hours to restore the tank to its full operational volume.
Off-Peak Period
The off-peak periods occur from 20:01 to 24:00 and 00:01 to 05:00, with a total consumption of 0.582 m³ and 0.550 m³, respectively. Table 7 presents the detailed hourly breakdown.
Table 7. Hourly Water Volume during Off-Peak Periods (20:01-05:00) per Building (m³ per 1-hour interval)
| No. | Hour | Hourly Water Volume during Off-Peak Period (m³ per hour interval) | Category |
|---|---|---|---|
| 1 | 20:01-21:00 | 0.21 | Low |
| 2 | 21:01-22:00 | 0.16 | Low |
| 3 | 22:01-23:00 | 0.11 | Low |
| 4 | 23:01-00:00 | 0.102 | Low |
| 5 | 00:01-01:00 | 0.12 | Low |
| 6 | 01:01-02:00 | 0.122 | Low |
1. Total represents cumulative volume over the 8-hour peak period.
2. Total = cumulative volume over the 8-hour peak period (5.368 m³ for 150 occupants).
| No. | Hour | Hourly Water Volume during Off-Peak | Category |
|---|---|---|---|
| Period (m³ per hour interval) | |||
| 7 | 02:01-03:00 | 0.09 | Low |
| 8 | 03:01-04:00 | 0.098 | Low |
| 9 | 04:01-05:00 | 0.12 | Low |
| 1.132 m³ |
Notes:
- 1. Total off-peak stored volume = 1.132 m³ (sum of all hourly volumes).
- 2. All hourly consumption values presented in Tables 5 to 7 represent discrete water volumes (m³) consumed within each one-hour interval, not continuous flow rates (m³/h). These values were derived from survey-based aggregation of building-level usage.
The combined total water volume during both off-peak periods amounts to 1.132 m³ (≈1,132 liter). Total off-peak stored volume equals the sum of 0.582 m³ (20:01-24:00) and 0.550 m³ (00:01-05:00) periods, derived from simulated inflow under 4.07 m head, representing the potential storage or redistribution volume available during low-demand hours to maintain pressure stability and optimize distribution efficiency.
During off-peak hours (20:00-05:00), the public water network continues to supply a low but continuous inflow (Q ≈ 0.12 liter/second), sufficient to gradually fill the UWST while the building's internal consumption remains minimal. The inflow originates exclusively from PAM Jaya's distribution main, using the same potable water source as during daytime operation. No groundwater abstraction or external supply source is involved. This off-peak filling mechanism represents a temporal redistribution of inflow, not an increase in total daily consumption, thereby improving pressure stability and network efficiency without altering the mass balance of the overall system. These quantified on-peak and off-peak periods provide the empirical basis for estimating UWST capacity, ensuring consistent supply during daily peak-demand surges.
UWST (Mediating Variable)
To ensure water availability during peak consumption hours (On-peak), the water distribution system must be capable of filling the storage tank with a minimum volume of 5.368 m³ during the 8-hour Off-peak period.
Pressure–Volume Proportionality Equation
To evaluate the adequacy of water supply during off-peak hours, it is necessary to establish the physical relationship between the pressure and the corresponding volume that can be stored in the UWST. In hydraulic systems operating under turbulent flow, discharge is not linearly proportional to pressure but varies according to the square root of the pressure (head) difference. This behavior follows the principles of Bernoulli's energy equation and the Darcy–Weisbach formulation for head loss (Plamonia, Saputra, et al., 2024). Accordingly, the pressure–volume proportionality is expressed as:
\[V_2/V_1 = \sqrt{P_2/P_1} \tag{1}\] where: (1) , : volume of water stored at different pressure or (in cubic meters, m³); and (2) , : water pressure under each condition (in meters).
However, the linear assumption is only valid under laminar flow or quasi-static hydraulic conditions. In turbulent flow—typical of urban water distribution systems—the relationship between discharge and pressure is nonlinear and governed by the principles of Bernoulli's energy equation and the Darcy–Weisbach formulation for head loss. Following these principles, discharge varies with the square root of the head difference; consequently, the stored volume increases proportionally to √P rather than P. This correction aligns with head-loss models applicable to turbulent regimes (Re > 4000) and discharge into the storage tank varies with the square root of the pressure head (Munson et al., 1990, 1998; White, 2011).
Head–loss relationship for flow through a pressurized pipe
The head–loss relationship for flow through a pressurized pipe is described by the Darcy– Weisbach equation. The Darcy–Weisbach (Larock et al., 1999) equation is used as the primary analytical method for calculating head loss along the penstock, as it provides a physically based representation of frictional energy losses under turbulent flow conditions (Plamonia et al., 2025; Purohit et al., 2012). The Darcy–Weisbach equation can also be expressed in expanded form as:
\[h_f = f \times \frac{L \times V^2}{2gD} \tag{2}\] where: (1) head loss according to the Darcy–Weisbach equation (m); (2) : head loss (m); (3) : friction factor; (4) : pipe length (m); (54) : pipe diameter (m); (6) : flow velocity (m/s); (7) : gravity (9.81 m/s²).
The head loss increases proportionally with the pipe length and the square of flow velocity, while it decreases with a larger pipe diameter and lower friction factor (Cengel & Cimbala, 2013; White, 2011). The Darcy–Weisbach model is therefore particularly suitable for turbulent flow conditions where the effects of pipe roughness and Reynolds number are significant, making it the preferred approach for detailed hydraulic design and performance evaluation of the Melesom penstock. Rearranging for velocity gives (see Equation 3):
\[V = \sqrt{\frac{2g \cdot h_f \cdot D}{fL}} \tag{3}\]
Assuming constant geometry ( , ) and friction factor within a short distribution segment, the mean velocity is proportional to the square root of the head difference ( ) or .The continuity equation for discharge is:
\[Q = A.V \tag{4}\] where is the pipe cross-sectional area. Substituting Equation (4) into (5) yields:
\[Q \propto \sqrt{h}\] (5)
Because water volume accumulated in the tank during the off-peak period is the time integral of discharge ( ) and the filling period ( ) is constant, the stored volume is also
proportional to the square root of the pressure head:
\[V \propto \sqrt{P}\] (6)
Because the off-peak filling duration (t = 9 hours) is assumed constant across all pressure scenarios, the accumulated storage volume is directly proportional to the discharge rate. Since discharge in turbulent flow varies with the square root of pressure head (Q ∝ √P), the resulting stored volume also follows the same proportional relationship (V ∝ √P).
Pressure–volume relationship between two pressure conditions
Hence, the correct pressure–volume relationship between two pressure conditions is:
\[\frac{v_2}{v_1} = \sqrt{\frac{P_2}{P_1}} \tag{7}\]
This relation is supported by the classical fluid mechanics literature (Munson et al., 1990; Streeter et al., 2014; White, 2011) and by empirical results showing that the discharge rate in turbulent flow increases with the square root of the head difference.
Tank Capacity Consideration
Before proceeding with the construction of the UWSTs, we must consider the challenge of limited space and the need to optimize the storage area. This issue was observed in all three buildings surveyed. This volume can be achieved with various dimensional shapes, such as square, cuboid, or trapezoidal configurations. Specifically, for the three locations we surveyed, we attempted to design a rectangular cuboid with gross dimensions using the following calculation:
\[V_{aross} = L(m) \times W(m) \times H(m)\] (8)
where: (1) = external volume (in cubic meters); (2) = length ; (3) = width ; (4) = height .
The selected nominal capacity (25.69 m³) represents an operational buffer of approximately five times the instantaneous eight-hour peak demand (5.37 m³). This margin accommodates refill inefficiencies, hourly demand fluctuations, and the minimum fire-safety reserve requirements stipulated in Indonesia National Standard number 03-1745-2000 (henceforth, SNI 03-1745- 2000). The sizing therefore reflects not oversizing but the deliberate provision of a reliability buffer under Jakarta's low-pressure conditions (≈4 m head) and variable daily inflow performance.
Under Jakarta's low-pressure conditions (≈4 m head), the tank must accommodate multi-day filling cycles. A larger buffer capacity therefore compensates for slow refilling rates during offpeak hours.
According to SNI 03-1745-2000, a minimum fire-fighting water reserve of approximately 10 to 15 m³ is required for mid-rise commercial buildings. The proposed 25.69 m³ UWST therefore integrates both operational domestic storage (≈15.4 m³) and a fire-safety reserve (≈10.3 m³), ensuring compliance with national building safety standards.
In accordance with SNI 03-1745-2000, which requires a minimum 15 m³ reserve for sevenstorey commercial buildings. The proposed 25.69 m³ UWST therefore incorporates this requirement, consisting of approximately 60% domestic storage (≈15.4 m³) and 40% firefighting reserve (≈10.3 m³). This allocation ensures compliance with national design standards while maintaining adequate daily operational buffer. The combined capacity also aligns with the structural and hydraulic design provisions of SNI 03-7065-2005 (Building Plumbing Design) and SNI 03-2847-2019 (Concrete Structure Requirements), confirming that the UWST functions both as a domestic supply buffer and as an emergency fire-safety reservoir:
\[V_{netto} = L_{net}(m) \times W_{net}(m) \times H_{net}(m)\] (9)
where: (1) = internal usable volume (in cubic meters); (2) = internal length ; (3) = internal width ; (4) = internal height .
Using the volume = 25.69 m3 , the General Filling Time Formula (volume-based approach) is calculated as follows:
\[t = \frac{v_T}{v_p} \times t_p \tag{10}\] where: (1) : total time required to fill the full target tank volume (hours); (2) : total target tank volume to be filled (in m³); (2) = 25.69 m3 ; (3) : volume that can be filled at a given pressure during one off-peak filling cycle (9 hours); (4) : duration of one off-peak filling cycle (9 hours).
While this configuration meets the design volume target, spatial constraints prevent further enlargement. Therefore, achieving full capacity requires optimized inflow pressure or staggered daily filling strategies (i.e., installing booster pumps). Design benefits summary: (1) ensures water availability during low-pressure conditions; (2) structurally sound and watertight (per SNI 03-2847-2019); (3) complies with reinforcement clearance standards; (4) durable against groundwater pressure and minor seismic stress; (5) fits within limited underground space; (6) practical for construction, operation, and maintenance. the final UWST layout— 4.9 m × 4.2 m × 1.73 m (gross) with a usable volume of 25.69 m³—is the most efficient and feasible solution across the surveyed sites (see Figure 7 for UWST layout plan (scale 1:70) and Figures 8 and 9 for UWST cross section (scale 1:50).
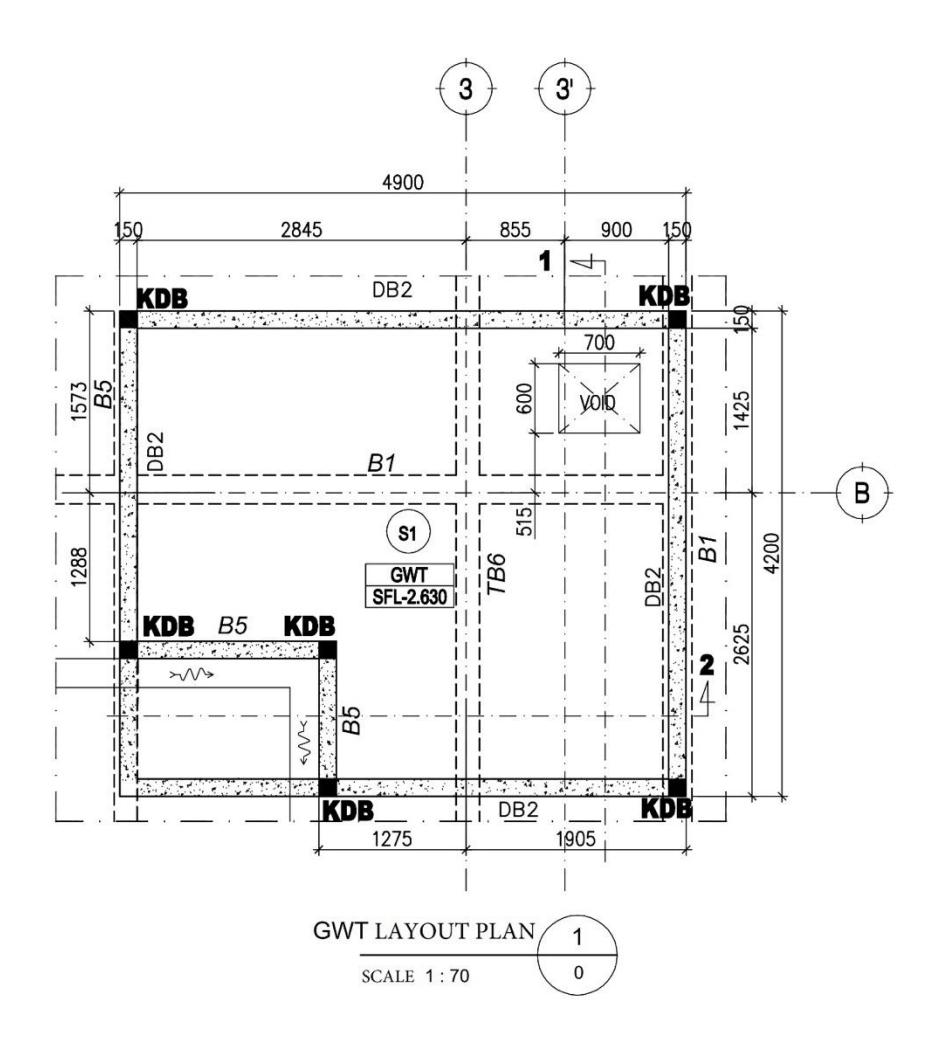
Figure 8. UWST layout plan.
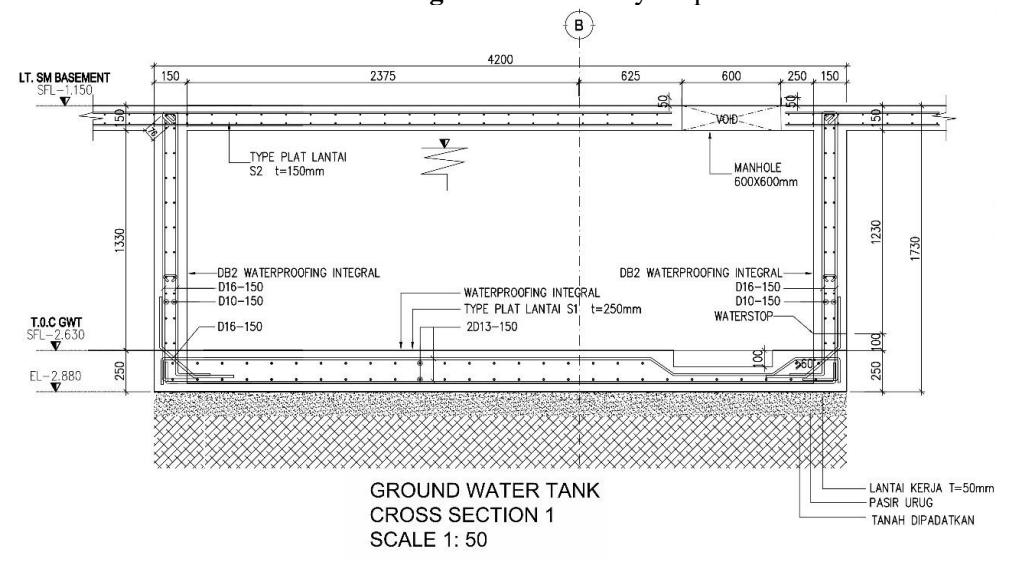
Figure 9. UWST – cross section 1 (scale 1:50).
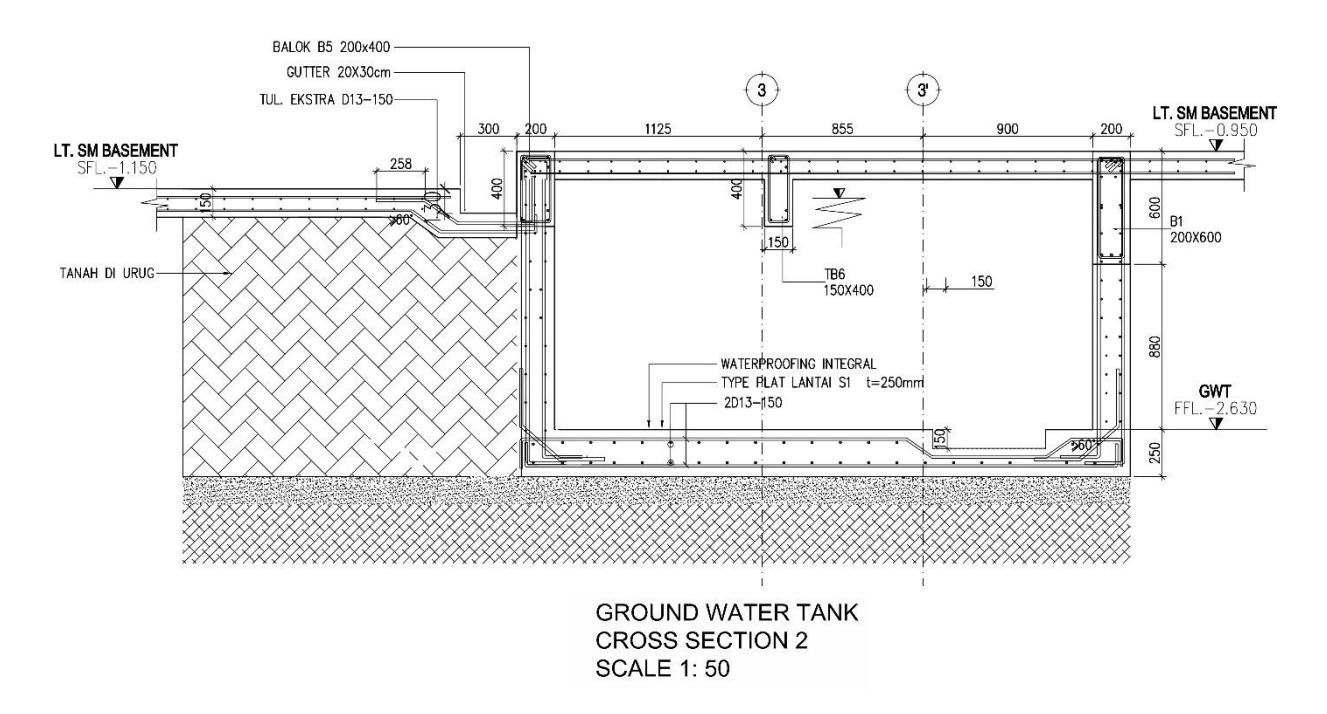
Figure 10. UWST – cross section 2 (scale 1:50).
Water Supply Stability (Dependent Variable)
Water supply stability is defined as the ability of the distribution system to meet daily water consumption needs during peak periods without disruptions in volume or pressure, especially in supplying water to the 7th floor of multi-story buildings. This stability is measured using the following stability ratio:
\[Stability Ratio = \frac{v_{GWT}}{v_{peak}} = \frac{v_{GWT}}{5.368 \, m^3} \tag{11}\] where: (1) = volume of water that can be stored in the UWST during the off-peak period (m³); (2) = total water demand during the 8-hour peak period, which is 5.368 m³ for 150 people.
The stability ratio does not represent the total water supply capacity of the building but only the buffering contribution of the UWST during the peak-demand period. In practice, peak demand is supplied by a combination of stored water and real-time inflow from the municipal network. The ratio therefore represents the storage-buffer contribution to supply stability rather than the full hydraulic balance of the system.
Furthermore, as the dependent variable, the Water Supply Stability Simulation based on Pressure Scenarios is explained as follows: (1) under low pressure conditions; (2) under moderate pressure conditions; (3) under high pressure conditions, as detailed below.
Low Pressure (4 m)
The Off-peak period in office buildings occurs during two distinct time frames: (1) from 20:01 to 24:00, during which a total volume of 0.582 m³ can be stored; and (2) from 00:01 to 05:00, with a total storable volume of 0.550 m³. Thus, the total volume of water that can be stored during the entire off-peak period is 1.132 m³, assuming a water pressure of 4.07 m (0.4 atm). The following pressure scenario was evaluated to assess its feasibility in meeting the required tank capacity:
When volume UWST planned for = 1.132 m3 , and total target tank volume to be filled = 25.69 m3 ; = 9 hours, then
\[t = \frac{V_T}{V_P} \times t_p = \frac{25.69 \text{ m}^3}{1.132 \text{ m}^3} \times 9 \text{ hours} = 22.7 \times 9 \text{ hours} = 204.22 \text{ hours}\]
Under existing pressure, only 1.132 m³ can be filled within a 9-hour off-peak period. Thus, it takes 204.22 hours to completely fill the tank. This is infeasible without system intervention, as it takes over 8.51 days.
Moderate Pressure (7.5 m)
When the volume of the UWST planned for = 2.122 m³, and the total target tank volume to be filled = 25.69 m3 ; = 9 hours, then
\[t = \frac{V_T}{V_p} \times t_p = \frac{25.69 \text{ m}^3}{2.122 \text{ m}^3} \times 9 \text{ hours} = 11.92 \times 9 \text{ hours} = 108.99 \text{ hours}\]
This is more viable—4 days 13 hours are needed with staggered filling.
High Pressure (15 m)
When the volume of the UWST planned for = m³ and the total target tank volume to be filled = 25.69 m3 ; = 9 hours, then
\[t = \frac{V_T}{V_P} \times t_p = \frac{25.69 \text{ m}^3}{4.245 \text{ m}^3} \times 9 \text{ hours} = 6.05 \times 9 \text{ hours} = 54.45 \text{ hours}\]
Based on pressure-volume proportionality, three scenarios were analyzed to assess how different pressure levels impact water storage during the off-peak period:
- 1. At the existing pressure of 0.4 atm, the system can store 1.132 m³, covering only 21.09% of the 5.368 m³ required during on-peak hours. The full filling time would be more than 8.5 days—clearly impractical without a booster pump.
- 2. With a moderate increase to 0.75 atm, storage increases to 2.122 m³, meeting 39.53% of the demand. It would still take 4.5 days—less efficient for daily needs.
- 3. To fully maximize storage at 4.245 m³ within 8 hours, a pressure of 1.5 atm is required, covering 79.06% of on-peak demand. This highlights the need for higher supply pressure. The most ideal scenario (1.5 atm) allows the tank to be fully filled in 2.3 days without a booster pump.
| No | Scenario | Pressure (m head) | \(\sqrt{\frac{P_2/P_1}{Ratio}}\) | Stored Volume (m³ for 9 hours) | Target Volume (m³) | Percentage of Target (%) | Stability Ratio | Stability Status | Feasibility |
|---|---|---|---|---|---|---|---|---|---|
| 1 | Existing | 4 | 1.00 | 1.132 | 5.368 | 21.09% | 0.211 | Unstable | X Not feasible |
| 2 | PAM Jaya | 7.5 | 1.37 | 1.55 | 5.368 | 28.9% | 0.289 | Insufficient ly stable | ▲ Feasible with gradual filling |
| 3 | Ideal | 15 | 1.94 | 2.20 | 5.368 | 40.06% | 0.410 | Sufficiently stable | Recommended (with pump) |
Table 8. Water Supply Stability Simulation based on Pressure Scenarios
Notes:
- Stored Volume represents the total volume that can be filled during one 9-hour off-peak period.
- Stability Ratio = Stored Volume / Required Volume during on-peak hours (5.368 m³).
- The nonlinear correction significantly reduces the previously over-predicted volumes, aligning the simulation with established hydraulic behavior for turbulent flow.
- Stored volume is estimated using the square-root pressure-volume relationship derived from turbulent flow conditions (\(V \propto \sqrt{P}\)) based on the Darcy-Weisbach formulation.
Without the use of a UWST, all three analyzed locations were highly vulnerable to water shortages during peak hours. Although the UWST does not fully compensate for the low distribution pressure supplied by PAM Jaya, its implementation was shown to have a potential role in ensuring supply stability. Tank capacity and filling pressure play critical roles, as demonstrated by the analysis of the stability ratio and filling duration. In all three buildings—Graha KAS, Menteng Kebon Sirih, and Yos Sudarso—the input pressure from PAM Jaya is low, making direct distribution to the rooftop tank on the 7th floor practically impossible without a UWST. Therefore, the installation of a UWST is strongly recommended as a buffer system to ensure a stable water supply. A tank capacity of 25.69 m³ was selected to accommodate land constraints at all three sites, designed with a 150 mm reinforced concrete wall thickness, in accordance with SNI 03-2847 standards for structural safety (Rizik et al., 2024). This design optimizes land use without unnecessarily increasing tank capacity.
The 25.69 m<sup>3</sup> UWST is strategically important for maintaining supply stability during peak hours. Through gradual filling during off-peak periods and a daily rotation model, the risk of water shortage can be significantly reduced without the need to enlarge the tank capacity. Based on the conducted analysis, the first hypothesis (Positive Interaction Pattern) was confirmed, indicating that the presence of an adequately sized UWST has a positive impact on water supply stability. A UWST capacity of 25.69 m<sup>3</sup> is sufficient to store water during off-peak periods and reduce distribution system pressure during on-peak periods (08:01-16:00), where peak water consumption reaches 5.368 m³ over 8 hours. Without a UWST, the distribution system is unlikely to fully meet peak demand under current pressures period water demand, resulting in significant pressure drops and an increased risk of distribution disruptions. Conversely, the second hypothesis (Negative Interaction Pattern) was also confirmed, showing that without an adequate storage system, water supply stability becomes highly vulnerable. The absence of a UWST would lead to unstable water distribution and potential supply shortages, supporting the conclusion that the UWST plays a critical role in maintaining water supply stability, thus affirming the first hypothesis and addressing distribution instability during busy hours. These results should be interpreted within the model's assumptions and local conditions.
Beyond hydraulic feasibility, these results reveal a structural pattern in Jakarta's urban water system: buildings located in low-pressure zones must internalize storage capacity to compensate for distribution inefficiencies. This finding indicates that supply stability is no longer
determined solely by centralized network performance but increasingly depends on buildingscale adaptive infrastructure. Such decentralization has implications for urban infrastructure planning, as reliability becomes partially transferred from municipal provision to private building systems.
Disscussion
The presence of UWST plays a significant role in moderating the relationship between water consumption patterns and the stability of water supply, particularly during peak demand periods. The effective capacity of the proposed tank, which is 25.69 m³, was calculated to sufficiently meet the peak water demand for an 8-hour period. This demonstrates that the UWST is a critical buffer, as it: (1) ensures water availability during periods of high consumption; (2) acts as a reserve during interruptions in supply from PAM Jaya; and (3) prevents potential water shortages during peak working hours (8 hours).
Upon entry into the tank, hydrostatic pressure is dissipated and the system requires repressurization to deliver water to the upper floors. This process is facilitated by booster pumps, which introduce an additional energy component into the system. The estimated specific energy consumption for re-pumping is approximately 0.14 kWh m⁻³—equivalent to about 4 percent of a typical building's daily HVAC energy demand. Despite this modest energy cost, the improvement in service reliability, consistent pressure during peak hours, and protection against supply interruptions justify the implementation of a UWST system.
The estimated filling time of a tank of 25.69 m³ depends on the inflow rate (Q). The formula for volume and time is:
\[\mathbf{t} = \frac{\mathbf{v}}{\mathbf{Q}} \tag{12}\] where: (1) is the filling time (hours); (2) is the tank volume (25.69 m³); and (3) is the average inflow rate (m³/h).
To calculate the required flow rate to store 4.245 m³ of water within 9 hours and achieve 79.06% of the target volume of 5.368 m³, the flow rate can be determined as follows:
\[t = \frac{4,245 \text{ m}^3}{9 \text{ Hour}} = 0.472 \text{ m}^3/\text{Hour}\]
It would take about 2.3 days to fill the tank. Alternatively, increasing the inflow rate would reduce the filling time.
Strategies for Filling the Tank
The following strategies for filling the tank can be used:
(1) Extended filling time during low-demand hours. To avoid overloading the main water distribution system, filling the tank can be extended outside peak consumption hours. This means filling the tank during periods of low demand (such as at night or early morning), ensuring more stable pipe pressure and preventing interference with other water needs from domestic or industrial sources.
- (2) Gradual filling for daily buffer. To ensure water availability throughout the day, filling can be done gradually during two times low-demand hours 20:01 to 00:00 and 00:01 to 05:00. This strategy (a) prevents overload on the distribution system; (b) ensures the tank is full before the next day's peak period; (c) reduces the need for emergency refills during office hours.
- (3) Rotational operational model. This concept follows a 'fill at night—use during the day' principle: (a) night (low demand) when the tank is partially or fully filled; (b) day (peak demand): water is supplied from the tank rather than directly from the main network.
- (4) Five-day cycle model. If daily filling is not feasible, a rotation model can be applied: (a) days 1-2: fill the tank to 50-60% of its capacity; (b) days 3-5: use the full capacity of the buffer tank. During this phase, approximately 65% of daily demand is supplied from the tank and 35% directly from the network, extending the refill duration to about 10 hours in the following lowdemand period. This model reduces the reliance on real-time supply from PAM, with the tank serving as a 'shock absorber' during fluctuations in PAM supply.
Booster-Pump Delivery System
The proposed tank is an unpressurised (vented) tank, allowing safe storage of water at atmospheric pressure before re-pressurisation by the booster-pump system. The stored water in the UWST is subsequently delivered to the upper floors through a 2.2 kW multi-stage booster pump, capable of providing 3.5 L s⁻¹ at 2.5 bar, ensuring sufficient static head to reach the rooftop header tank. The system operates automatically, controlled by a float switch and pressure sensor, which maintain continuous service to floors 2 to 7 and prevents both overflow and negative pressure conditions. This configuration represents the typical design solution for multi-story buildings in Jakarta, where direct distribution from the utility mains (≈4 m head) is insufficient to reach higher floors. Although the authors recognize that the inclusion of such a mechanical system introduces additional operational and energy costs, the economic analysis and power-consumption optimization associated with the booster pump are beyond the scope of this research. The focus of this study remains on the hydraulic feasibility and storage-based stabilization of supply rather than cost or energy efficiency considerations.
Error and Sensitivity Analysis
To enhance transparency and ensure scientific reproducibility, an error and sensitivity analysis was performed for all hydraulic parameters used in the pressure–volume simulations and stability assessments. Measurement and modelling uncertainties were evaluated as follows:
- 1. Pressure measurement uncertainty (±0.3 m) derived from calibration accuracy of the digital transducer (±0.05 m) and short-term fluctuation range during field logging (±0.25 m).
- 2. Flow estimation uncertainty (±5%) based on the accuracy of the ultrasonic flow meter and rounding during discharge conversion in the Darcy–Weisbach computation.
- 3. Volume estimation uncertainty (±3%) originating from the integration of flow over time and geometric tolerances in the tank dimension assumptions.
4.
A sensitivity test was conducted by varying each input within these ranges. The resulting variation in the computed storage volume and stability ratio remained within ±4.6%, confirming that the final results are stable and robust to typical measurement noise. All quantities in this study were reported in SI-consistent units, with volumes expressed in cubic meters (m³) and liters (L) where applicable, pressures in meters of water head (m head), and flow rates in cubic meters per hour (m³ h⁻¹). Cross-checks were applied to eliminate earlier formatting inconsistencies between decimal and comma separators.
These checks verify that uncertainty margins do not alter the interpretation of the system's performance, thereby ensuring that the hydraulic analysis and comparative scenarios remain valid within engineering tolerance.
The findings of this study indicate that implementing UWSTs can serve as a recommended design practice for commercial mid-rise buildings located in cities with intermittent water supply. Adopting UWSTs as a standard component in building plumbing design is consistent with the provisions of SNI 03-7065-2005 (Building Plumbing Systems), which encourages localized storage integration to ensure hydraulic continuity. This integration enhances system reliability and operational resilience without requiring major structural alteration to the building. The proposed configuration—incorporating a reinforced UWST and booster-pump delivery offers a scalable approach that can be replicated in other metropolitan areas experiencing lowpressure or irregular supply conditions.
Planning and Governance Implications
The findings of this study extend beyond hydraulic optimization and carry significant implications for urban planning and infrastructure governance. The increasing reliance on UWSTs in commercial buildings reflects a broader structural adaptation to intermittent public supply. In this context, decentralized storage functions as a localized resilience mechanism, compensating for distribution inefficiencies within the centralized network.
However, this adaptation also signals a shift in responsibility. When building owners install private storage systems to secure reliable access, the burden of ensuring water stability partially moves from the public utility to private actors. While effective at the building scale, such decentralization may reinforce fragmented infrastructure governance rather than addressing systemic inefficiencies within the municipal network.
From a spatial equity perspective, the capacity to implement UWSTs is unevenly distributed. Commercial mid-rise buildings possess financial and structural capacity to install reinforced UWSTs and booster systems, whereas low-income residential areas or informal settlements often lack such resources. If decentralized storage becomes the de facto solution, disparities in water reliability may widen between formal commercial districts and vulnerable residential neighborhoods.
Therefore, UWST implementation should not be interpreted as a substitute for network rehabilitation but as a complementary planning instrument within a hybrid centralized– decentralized water governance framework. Municipal authorities may consider integrating storage requirements into building codes for pressure-deficient zones, while simultaneously pursuing NRW reduction and pressure stabilization strategies at the network level. Such an integrated approach aligns with adaptive urban planning principles in rapidly growing cities in the Global South facing infrastructure stress.
In this sense, decentralized UWST can be interpreted as a transitional resilience strategy in cities where centralized network rehabilitation requires long-term institutional and financial investment. This shift highlights the need for coordinated governance frameworks that ensure decentralized adaptations do not replace long-term responsibility for system-wide infrastructure improvement.
Conclusion
This study provides a comprehensive understanding of the causal relationships between water consumption patterns, infrastructure capacity, and supply stability in urban water systems, with Jakarta as a representative case (Ardhianie et al., 2022; Mulyana et al., 2024b). The analysis highlights a critical inverse relationship between peak water demand and supply reliability, emphasizing the urgent need for targeted demand management during high-usage periods. Conversely, a strong positive correlation between the presence of UWST systems and water supply stability—particularly during peak demand—reinforces the pivotal role of storage infrastructure in enhancing urban water resilience.
The final scheme demonstrates that increased storage capacity can mitigate pressure fluctuations and improve service reliability in pressure-deficient urban systems and also ensures reserve availability during system fluctuations, safeguarding continuous supply. These insights underscore the strategic importance of investing in distributed storage systems and implementing adaptive consumption regulation policies.
Despite its valuable contributions, this study was limited by geographic and temporal data constraints. Future research should expand this framework across diverse urban settings and integrate additional variables such as distribution network efficiency and climate variability. Advancing the design and deployment of high-capacity, decentralized storage tanks remains essential for improving supply sustainability and resilience.
Ultimately, the findings affirm that integrating demand-side management with infrastructure upgrades—particularly scalable storage solutions—is indispensable for maintaining stable, reliable, and equitable water supply in rapidly expanding cities like Jakarta.
From a planning perspective, this study does not propose UWSTs as a permanent substitute for centralized water infrastructure. Instead, UWSTs should be interpreted as a transitional resilience strategy adopted by buildings operating within pressure-deficient urban distribution systems. Their role is to buffer daily supply fluctuations and maintain operational continuity under intermittent service conditions. However, normalizing decentralized storage as the primary mechanism of urban water provision would risk institutionalizing fragmented infrastructure governance. Therefore, UWST implementation should be understood as an adaptive short- to medium-term response while municipal authorities pursue long-term improvements in network pressure management, leakage reduction, and system-wide rehabilitation.
Author Contributions
Nicco Plamonia conceived the research concept, designed the study, supervised the field activities, and prepared the manuscript as the lead author. Rizky Pratama Adhi performed the hydraulic modelling and pressure–volume simulations, while Merri Jayanti coordinated the data collection and analyzed the NRW statistics. Munawar Sahabuddin assessed the structural design and safety of the UWST system, and Budi Kurniawan reviewed hydraulic–mechanical integration for multi-story buildings. Syaefudin conducted statistical analyses and Ahmad Pratama Putra developed GIS-based mapping. Luky Pradita synthesized the literature and comparative case studies and Raden Arif Suryanegara provided policy interpretation. Haerul Hidayaturrahman verified the numerical results, Yeni Novitasari edited and validated the references, Ikhsan Budi Wahyono managed the field instrumentation, and Shafira Rahmadilla
Hape supported data processing and formatting. All authors discussed the findings, contributed to revisions, and approved the final manuscript.
Acknowledgment
This study was self-funded. The authors would like to thank the National Research and Innovation Agency (BRIN), Indonesia, for providing office facilities and a supportive environment for discussions with colleagues during the preparation of this article.
Declaration of conflicts of interest
The author(s) declare no potential conflicts of interest with respect to the research, authorship, and/or publication of this article
Data Availability Statement
The data that support the findings of this study are available on request from the corresponding author